Go to the ASTRON VO for data access
Go to the related publication(s)
Introduction
Apertif (APERture Tile In Focus) is a phased array feed (PAF) system for the Westerbork synthesis radio telescope (WSRT) designed for performing wide field surveys of the northern sky (van Cappellen et al. 2022). During its operations in 2019 – 2022, the Apertif surveys covered about 2300 square degrees (Hess et al. in prep). The first imaging data release took place in 2019 and is described in Adams et al. (2022).
The default Apertif pipeline, Apercal1, includes automatic calibration and imaging procedures (Adebahr et al. 2022). However, it provides only a direction-independent calibration, where the resulting images often show direction-dependent effects (DDEs ), therefore not sufficiently reliable for obtaining science-quality images.
We have developed and applied a new procedure which includes both direction-independent (DI and direction-dependent (DD) self-calibration to process Apertif data. The DD processing is based on the LOFAR Default Preprocessing Pipeline (DPPP/DP3; van Diepen et al. 2018) and the wsclean imaging package (Offringa et al. 2014). The code and documentation of the new pipeline are available at GitLab. The image of each compound beam of an observation is calibrated independently. The new pipeline starts with the pre-flagged cross-calibrated continuum visibilities produced with the initial steps of Apercal. For many of these data sets, additional flagging of antenna-beam combinations is made for which the DD errors are very large. Following this, a DI calibration is performed. This step includes three cycles of self-calibration and imaging. First, a phase-only self-calibration while the final step in the DI calibration is an amplitude and phase calibration. The second and third CLEAN step in the DI self-calibration are done using masks based on the local signal-to-noise ratio estimated from the residual images of the previous step. After the DI calibration, a clustering procedure is performed. The final CLEAN model obtained after the DI calibration is segmented using Voronoi tessellation, for which the cluster centers located at the 10 brightest sources. With this segmented model, DD calibration is performed by calibrating each segment independently. This step is performed subtracting the model visibilities from the DI calibrated data with the DD calibration solutions applied. The residual visibilities, free from DDEs, are then imaged, and the final DI model is restored on this image. This final compound-beam image is produced with a size of 3072 × 3072 pixels and a pixel scale of 3′′.
These pages describe the Apertif 1.4 GHz mosaic images obtained with this pipeline for several deep fields observed by LOFAR: Bootes, Elais-North and Lockman Hole. A detailed description of the data processing for the Boötes fields, and Elais-North and Lockman Hole fields, can be found in Kutkin et al. (2023) and Kutkin et al. (in prep.), respectively.
Fields released so far
| Boötes | The image covers 26.5 square degree region, has an angular resolution of 27 × 11.5 arcseconds and a median background noise of 40 μJy/beam. The corresponding source catalog, complete down to the 0.3 mJy level, includes 8994 sources. |
| ELAIS-N | The image covers 25 square degree region, has an angular resolution of 18 × 11 arcseconds and a median background noise of 37 μJy/beam. The corresponding source catalog, complete down to the 0.3 mJy level, includes 8526 sources. |
| Lockman Hole | The image covers 136 square degree region, has an angular resolution of 15 × 13 arcseconds and a median background noise of 27 μJy/beam. The corresponding source catalog, complete down to the 0.3 mJy level, includes 55166 sources. |
Observations & Processing
In total, Apertif observed about 2300 square degree of the sky with some pointings covered several times. We process the Apertif data obtained for the field mentioned above.
To obtain a final mosaic image, the astrometric accuracy of the images was first improved by cross-matching sources from each individual image with those in the LOFAR HBA image and by correcting the astrometry of the Apertif images with the median position offset. The typical offset was found to be about 1'' with only a few exceptions. After this, the images were combined in the standard way using the mosaic package described in Kutkin et al. 2022. This procedure includes a correction of the images for the compound-beam shapes (we use the same beam models here as in Kutkin et al. 2022) that reconvolves the images to a common angular resolution and reprojects them onto the common sky grid. Because individual Apertif images overlap, the mosaicking leads to an increase in sensitivity.
- The Boötes field has been covered by Apertif with 187 compound beam images from 8 different survey observations performed between April 2019 and November 2021. The self-calibration and imaging procedure was performed with the newly developed pipeline described by Kutkin et al. 2023.
Data Quality
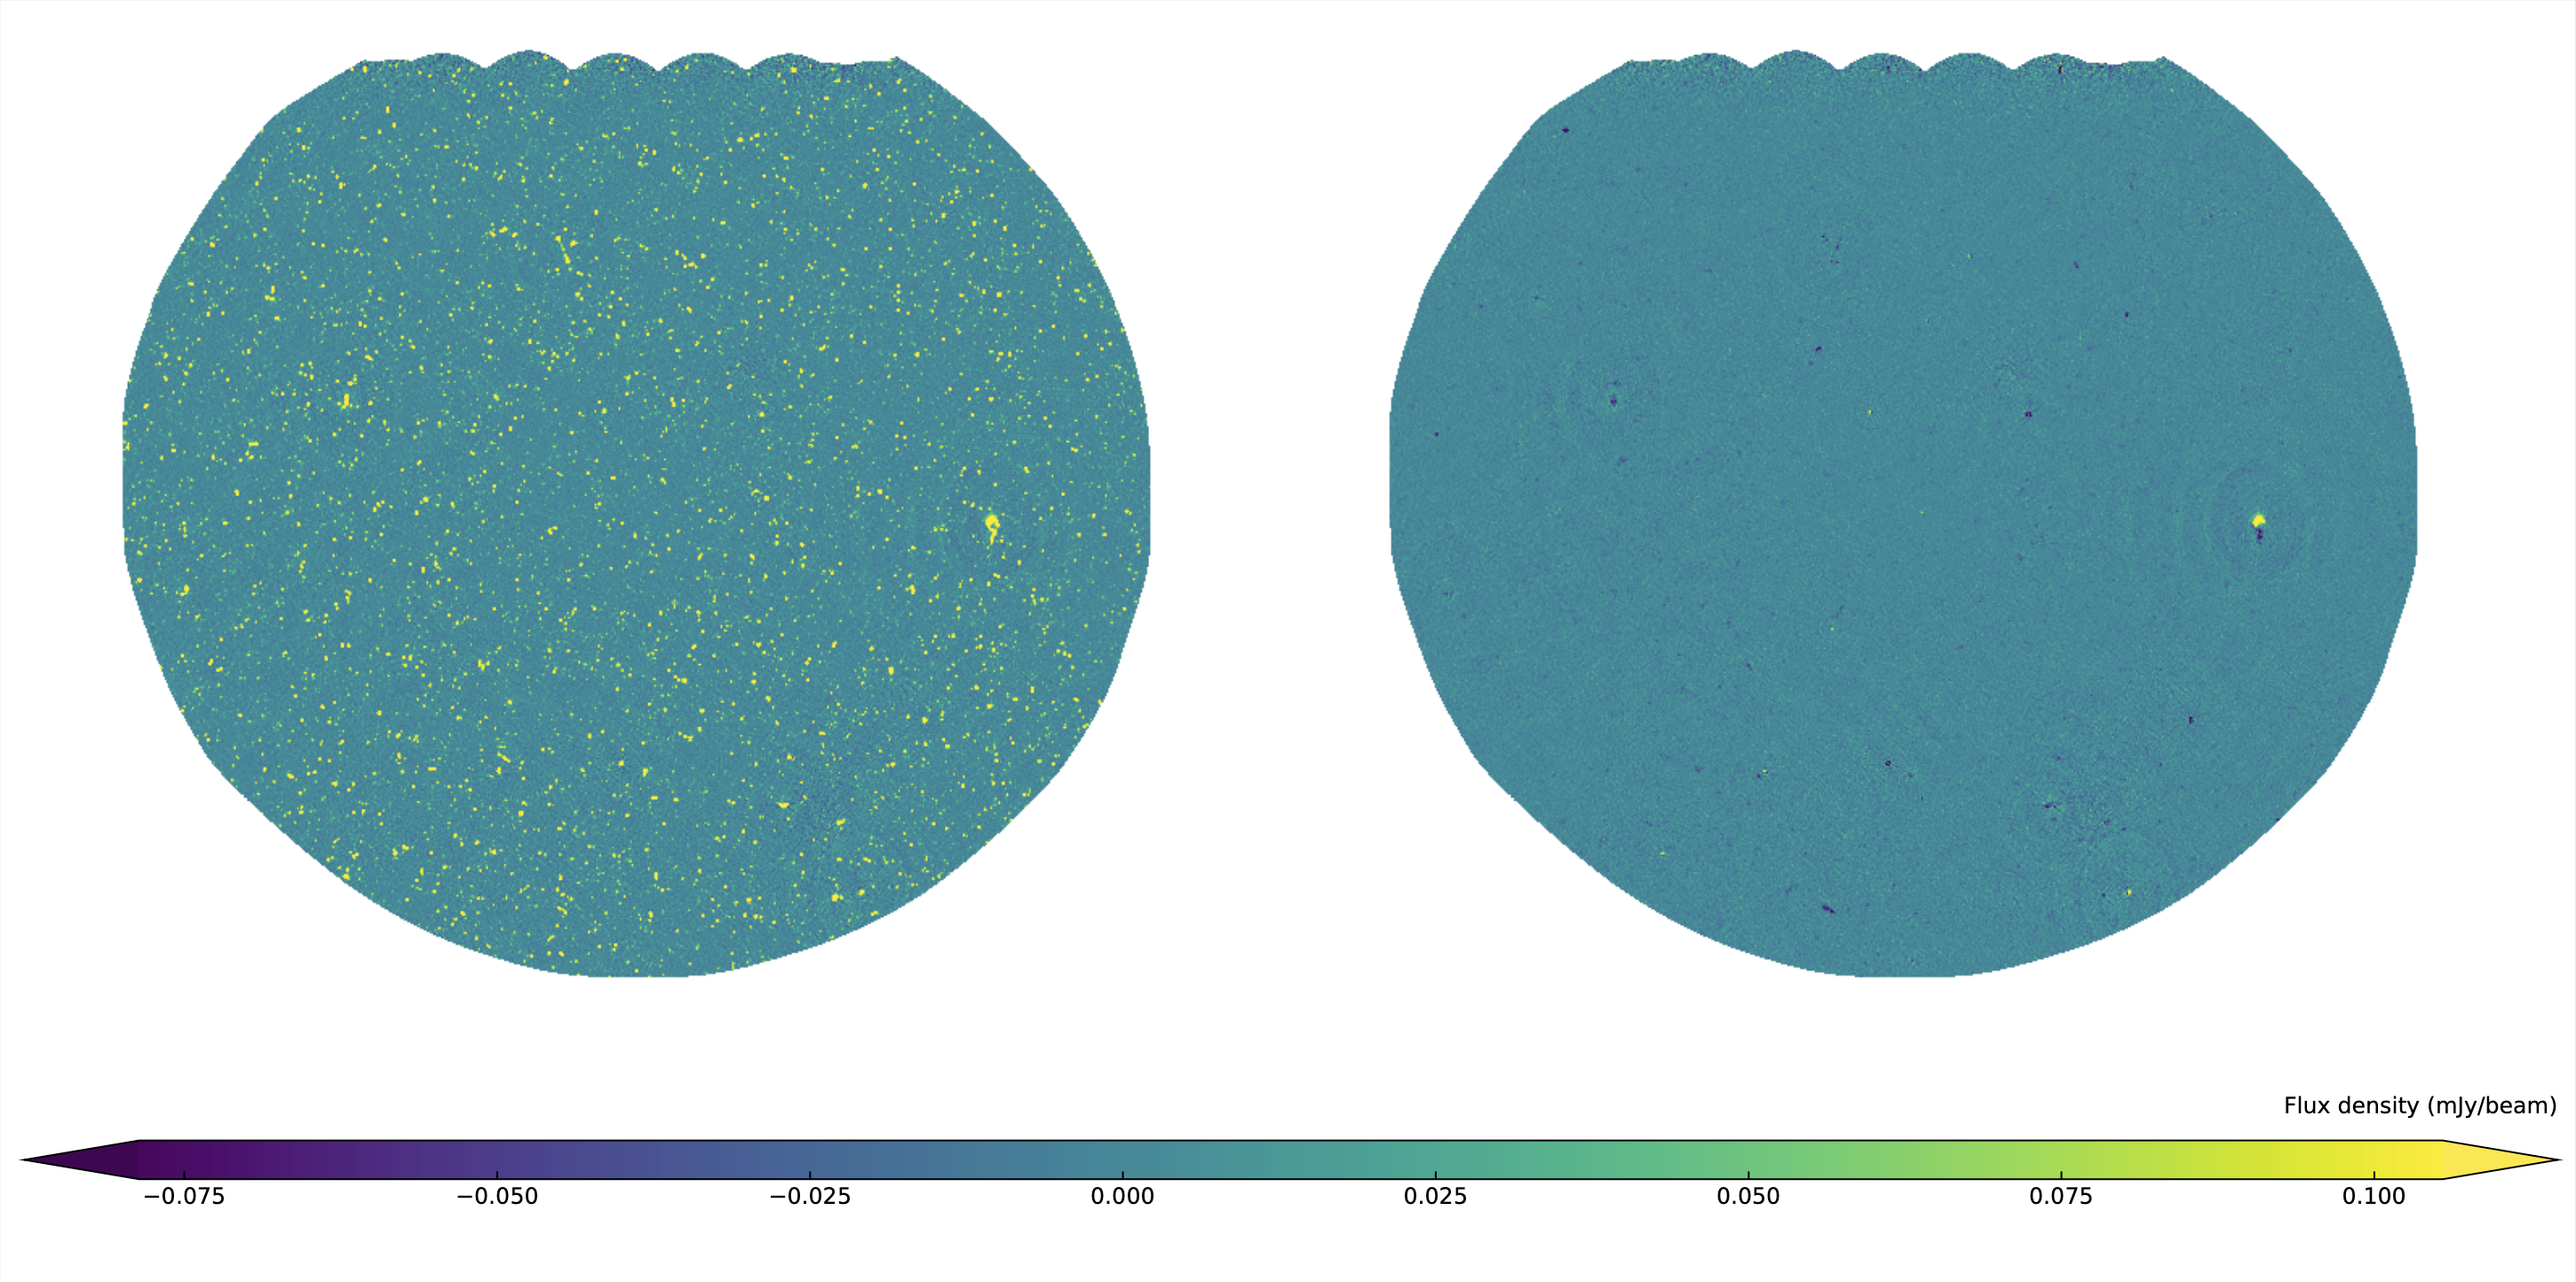
The quality of the images was validated according to the procedure described by Adams et al. 2022. The direction-dependent calibration allowed us to achieve a significant improvement of the quality of the individual images compared to the automatic pipeline without DD-calibration. This is illustrated in the Figure below.
The fraction of compound-beam images that pass the quality validation increased from 40 % using the default pipeline to 98 % with the new pipeline.
The completeness and reliability of the corresponding catalogs are estimated as described by Kutkin et al. (2022, 2023).
Data Products
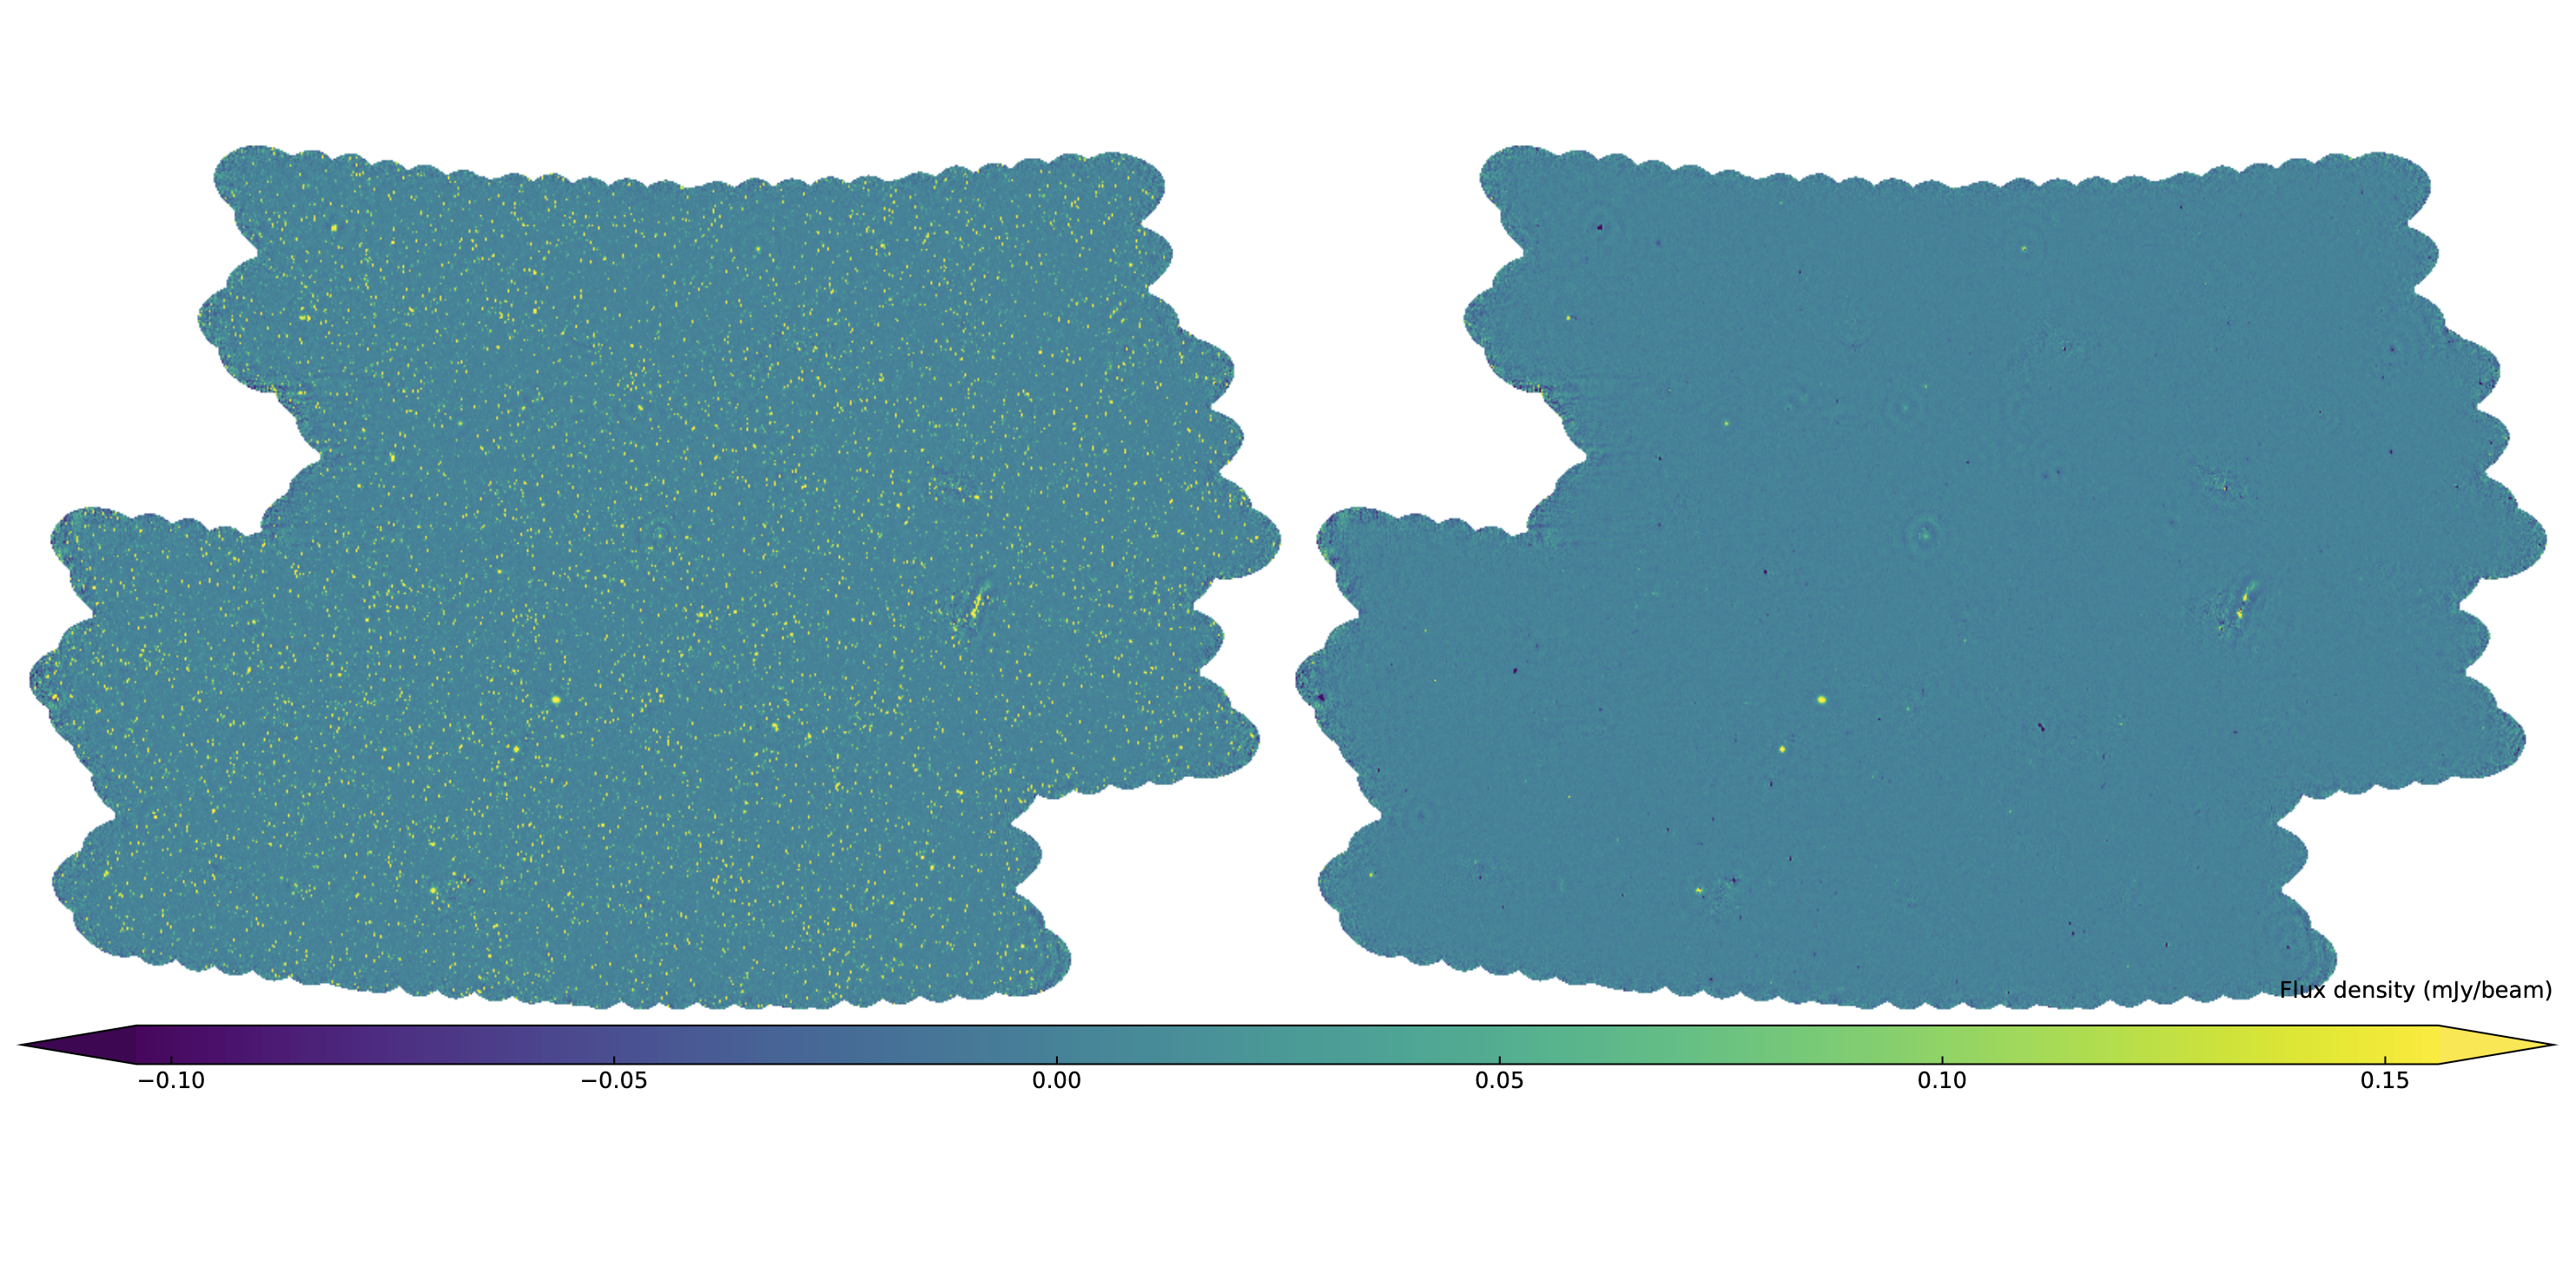
For each field, we release a mosaic image in the FITS format and the corresponding source catalog in CSV format. The following figures show the mosaic images (left) and the noise maps (right) for the three released fields. For more information about the resolutions and noise levels, see table above.
As an example, the catalog table for the Boötes field is shown below:

The column designations of the catalog table are as follows:
Column (1): Apertif source name; Cols. 2 and 4: RA and Dec; Cols. 3 and 5: RA and Dec errors; Cols. 6 and 8: Total and peak flux density; Cols. 7 and 9: Integrated and peak flux density uncertainties;
and Cols. 10, 12, and 14: Deconvolved major and minor source size and position angle. A source size value 0.0 means that the PSF cannot be deconvolved from the fitted source along the given axis, and the corresponding uncertainty represents an upper size-limit estimate. The position angle is given in degrees ranging from --90 to 90 deg west to east through north. When both major and minor sizes are given as 0.0, the position angle is omitted. Columns 11, 13, and 15: Uncertainties of the major and minor source size and position angle; Col. (16): Local background noise rms; and Col. (17): Source type as classified by PyBDSF, with 'S' as an isolated source fitted with a single Gaussian; 'C' as sources that were fit by a single Gaussian, but are within an island of emission that also contains other sources, and 'M' as sources fit with multiple Gaussians.
Where to find the data
The catalogs and the mosaics can be found at https://vo.astron.nl.
Tables 1 and 3 are also accessible via CDS via anonymous ftp to cdsarc.u-strasbg.fr (130.79.128.5) or via http://cdsarc.u-strasbg.fr.
For more details about the vo.astron.nl please follow the instructions here.