Frequency Definition
The combination of analogue and digital signal processing both at station level and at the Central Processing facility allows for a flexible definiton of the total frequency range, subband selection, and spectral channel width.
The design of the A/D system allows for RFI detection of both broad- and narrow-band features
Setting the Observing Frequency
The Receiver Units (RCUs), which convert the antenna voltages to base-band frequencies, are designed to be sky noise limited. For this, a 12 bit Analogue to Digital converter, along with multiple bandpass filters, are used to select the frequency bands of LOFAR.
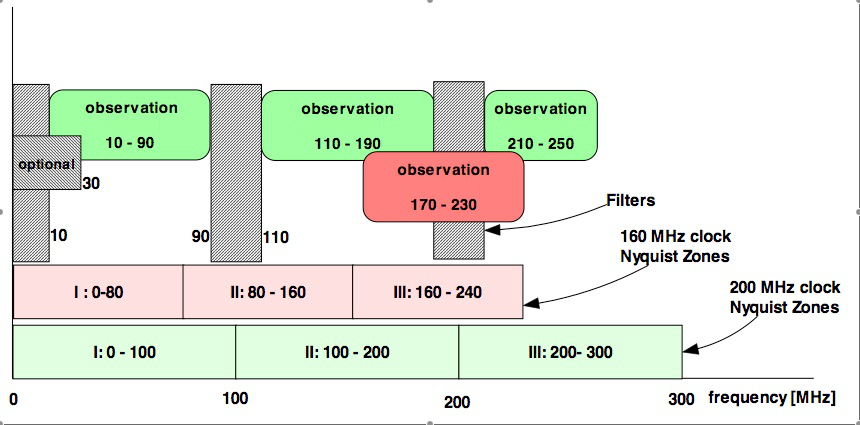
Two sampling clock frequencies, at 200 MHz and at 160 MHz, have been selected in the design to determine the standard observing frequency bands shown below:
| Freq. range (MHz) | Clock (MHz) | Array | Nyquist zone | Remarks |
|---|---|---|---|---|
|
10—90 |
200 |
LBA* |
1 |
Massive interference below 20 MHz during daytime. |
|
10—70 |
160 |
LBA* |
1 |
Aliasing of 80—90 MHz range into 80—70 MHz [This setup is not normally used in operations] |
|
30—90 |
200 |
LBA* |
1 |
Short wave radio suppressed. There may however still be some intermodulation products from shortwave radio during certain ionospheric conditions. |
|
30—70 |
160 |
LBA* |
1 |
Aliasing of 80—90 MHz range into 80—70 MHz [This setup is not normally used in operations] |
|
110—190 |
200 |
HBA |
2 |
HBA band with the least interference |
|
170—230 |
160 |
HBA |
3 |
HBA band affected by interference. It contains several digital audio stations. Final frequency selection should be done in close collaboration with the Science Data Center Operations. [ This band is not offered in cycles 14-17 ] |
|
210—250 |
200 |
HBA |
3 |
This band contains many digital audio stations. Final frequency selection should be done in close collaboration with the Science Data Center Operations. [ This band is not offered in cycles 14-17 ] |
Table 1: Frequency Ranges
After digitization from the RCU boards, the signal is further processed in the Remote Station Processing (RSP) boards, which use Field Programmable Gate Arrays (FPGAs).
Initially, at the station level, the total bandwidth of the digitized signal (100 MHz for the 200 MHz clock and 80 MHz for the 160MHz clock) is split in 512 sub-bands via a poly-phase filter (PPF), followed by a 1024-point Fast Fourier Transform.
These subbands have bandwidths of 195.3 kHz and 156.2 KHz, respectively for the 200 MHz and 160 MHz clock, as shown in Table 2.
This gives a total bandwidth of 95.16 MHz (200 MHz clock) or 76.13 MHz (160 MHz clock).
| Clock | Total Bandwidth | Sub-band width | Channel width (256 channels) |
|---|---|---|---|
|
(MHz) |
(MHz) |
(Hz) |
(Hz) |
|
200 |
95.16 |
195312.5 |
767.939 |
|
160 |
76.13 |
156250.0 |
610.352 |
Table 2: Subband and Spectral Line Channel Bandwidths
Following subsequent processing in the Central Processing Facility, to realign the data streams in time, a poly-phase filter is applied to re-sample the data to the kHz level, splitting each sub-band into a fixed number of frequency channels.
Typically, 64 channels per subband have been routinely used. RFI excision performs well with this setup and, unless users can convincingly argue that more channels are needed for their work, observations will be perfomed with this setup. For spectral-line work, up to 512 channels have been tested and proven to work in interferometric mode, therefore such a setup can be accommodated. However, note that such configuration has not been characterized. The user must take into account that the number of spectral channels proportionally increases the raw data size and the subsequent processing speed. These considerations should be made when applying for processing time for the next round of proposals.
Subband Naming Convention
Users will have to select the subbands they wish to observe at the time of proposing and observation scheduling.
In the convention of the observing system, each subband is identified by a number. This number is related to the sky frequency, where the number of the subband, S, containing a certain frequency, ν, is given by:
![]()
where n is the Nyquist zone (see Table above), νclk is the clock frequency (200 or 160 MHz), and ⌊ and ⌋ denotes the "floor" function.
Conversely, the central frequency of sub-band S is given by:
![]()
Because the sub-band separation is done using fixed poly-phase filters on a time series that is recorded at a fixed clock rate, LOFAR does not perform any Doppler tracking. That is, the frequencies are observed in a telescope based reference frame, not a geocentric, solar system barycentric, or sky frame. Such conversions should be performed offline by the PI, if necessary.
Some frequently used examples of subband selections are listed below:
| LBA frequency |
subband name | clock |
| 30-78 | 154-397 | - |
| HBA frequency |
subband name | clock |
| 115-163 | 77-320 | 200 |
| 148-196 | 245-488 | 200 |
| 180-210 | 128-371 | 160 |
| 210-250 | 52-255 | 200 |
Table 3. Naming convention of recommended subbands
Interference in the LOFAR frequency bands
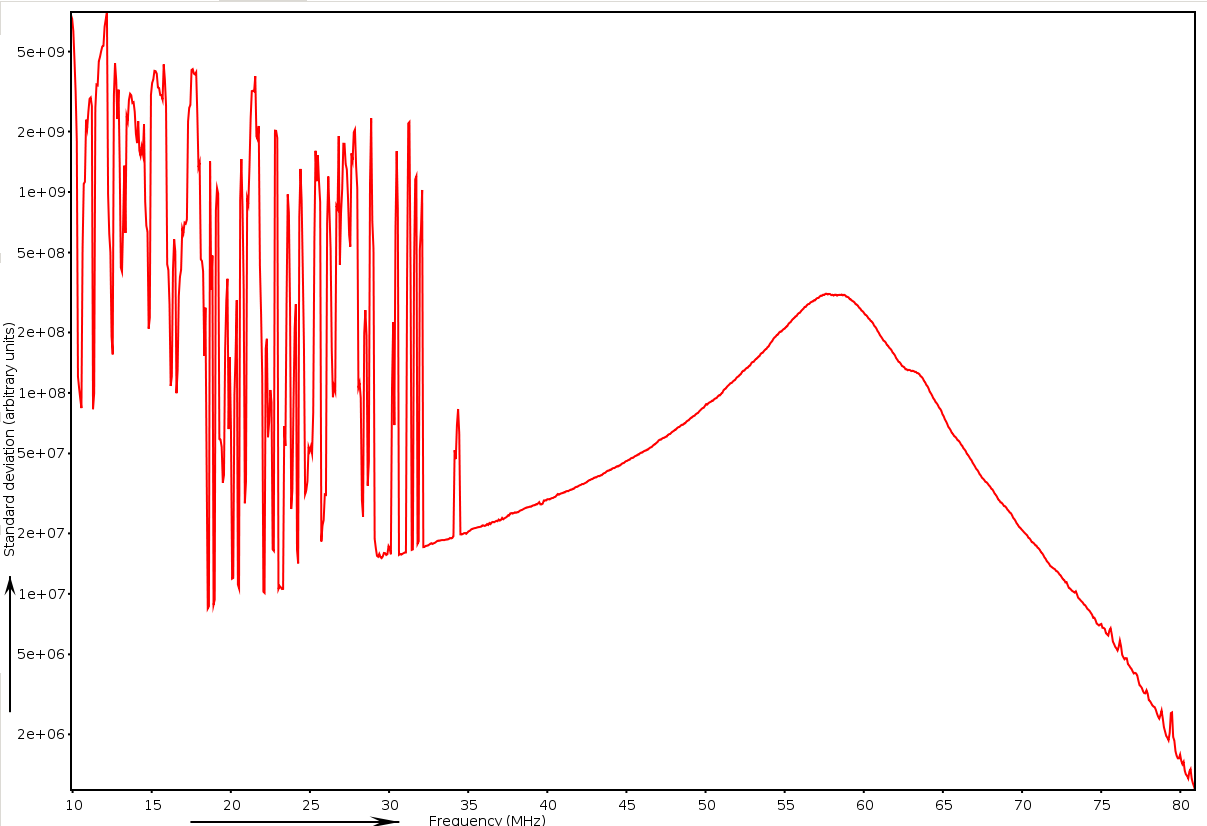
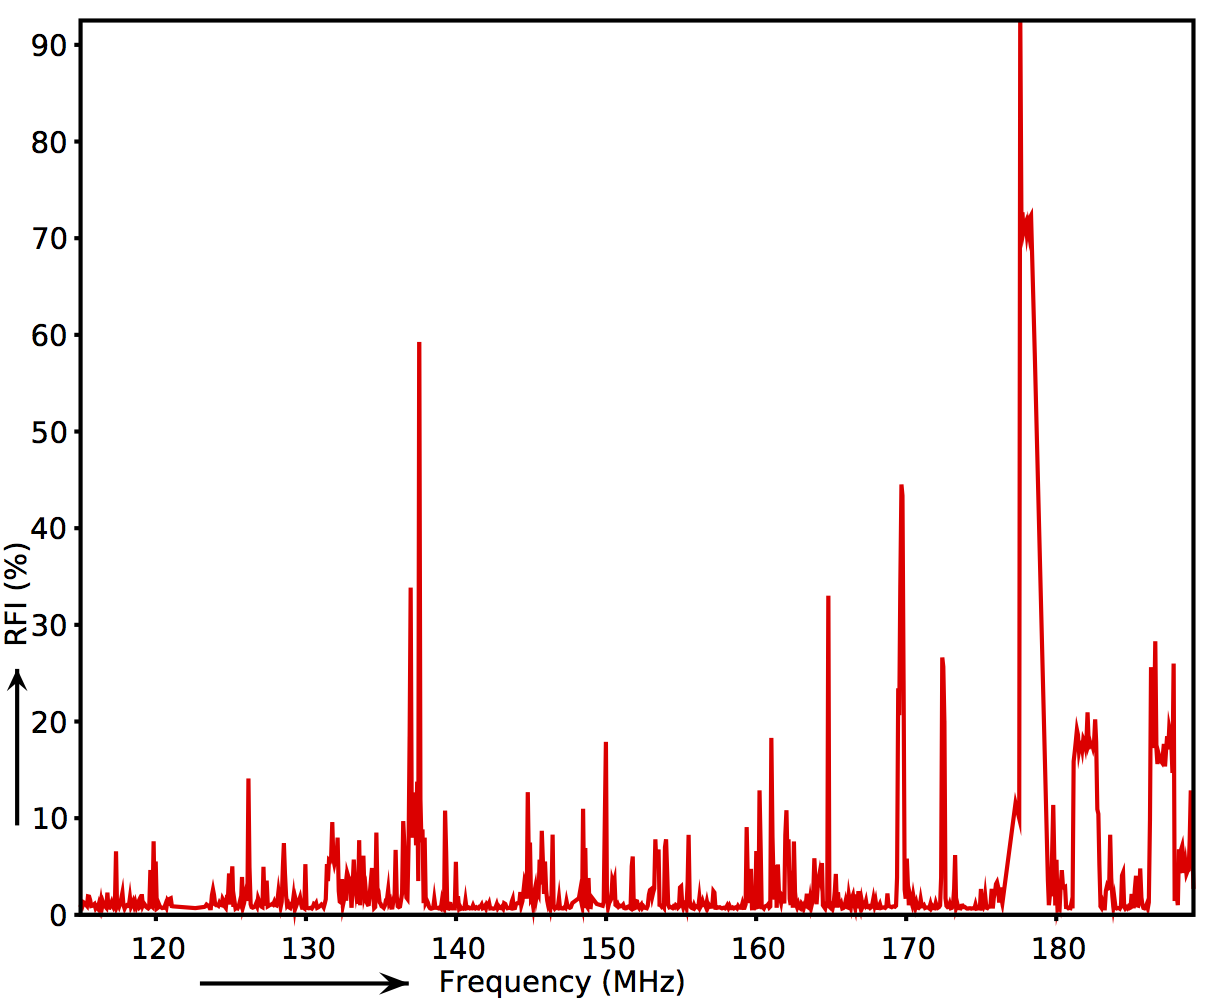
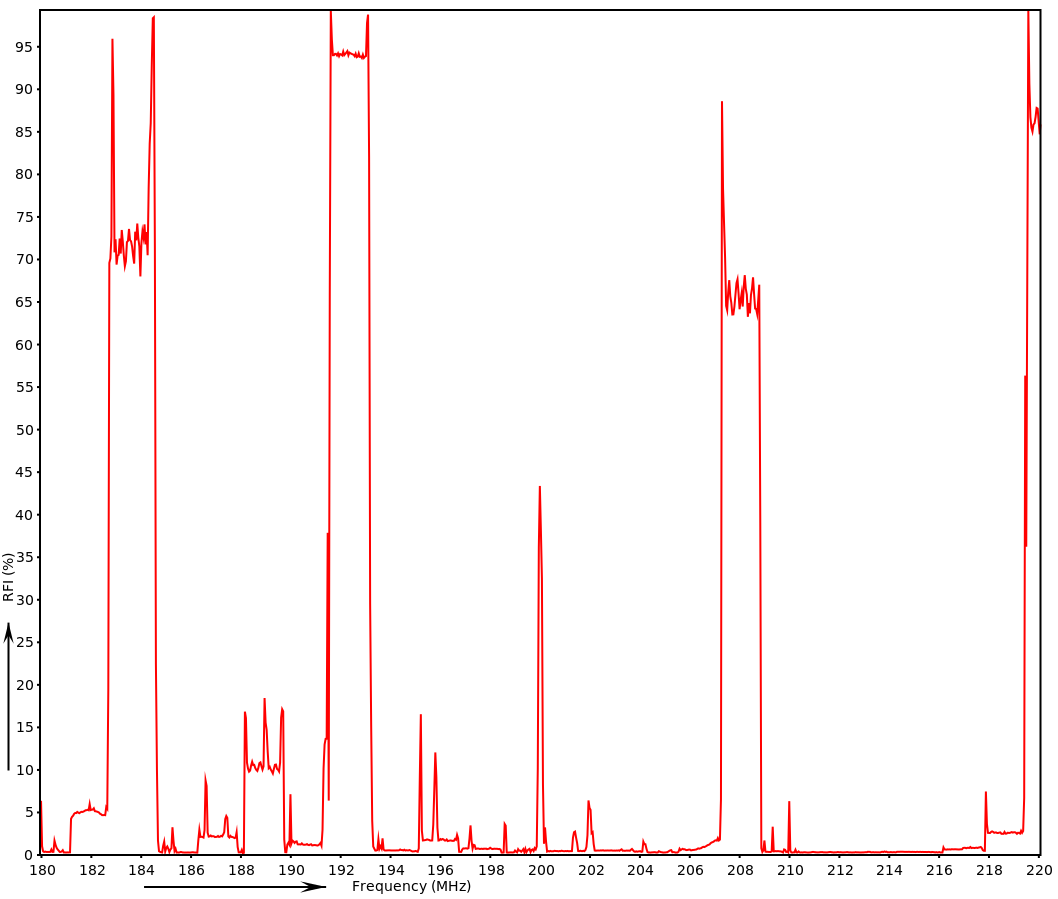
Below are plots of the typical RFI environment in the different LBA and HBA bands. The HBA has been split in three parts (HBA low, mid and high), which were observed independently and with different station clock modes. Parts of the HBA mid and high (around 225 MHz) ranges are contaminated by several broadband Digital Audio Broadcast (DAB) transmitters. In addition, the HBA low band (110 - 190 MHz) suffers interference from DAB inter-modulation products. Frequencies around 151, 157, 162, 166 and 175 MHz are most severely affected (for example, the r.m.s image noise can be more than 5 times higher compared to un-affected parts of the band, see image below; Jelic et al.). For more information, contact the SDC Helpdesk.

Towards lower frequencies in the LBA band (below 30 MHz), the data are more affected by interferences. For each band, two plots are shown: percentage and standard deviation of the detected RFI. The monitoring consists of 24 hours for the LBA and HBA high band and 15 hours for the HBA low band
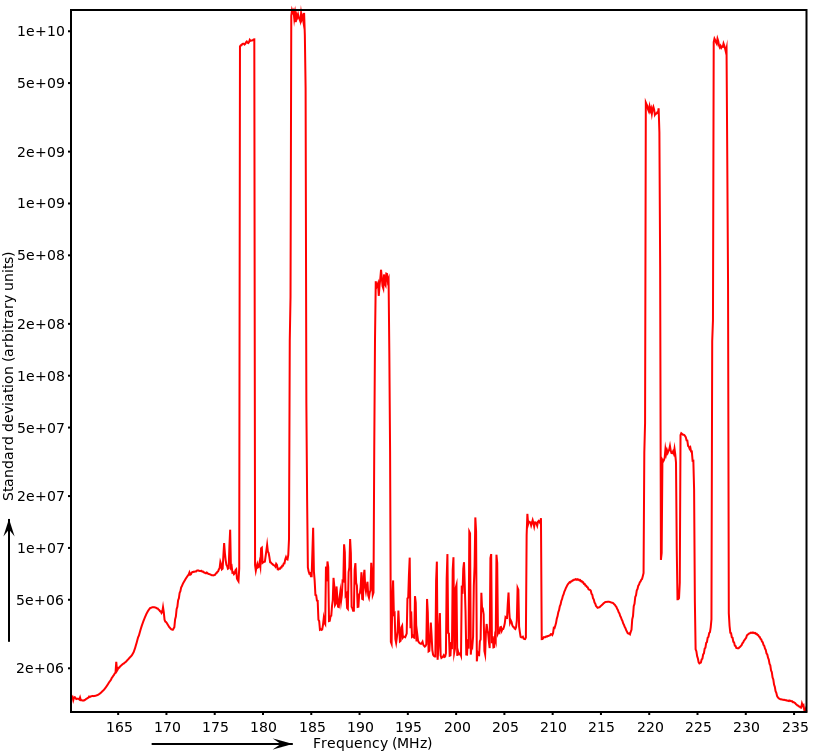
LBA: RFI % and Standard deviation spectrum

HBA low (clock 200MHz): RFI % and Standard deviation spectrum

HBA mid (clock 160MHz): RFI % and Standard deviation spectrum
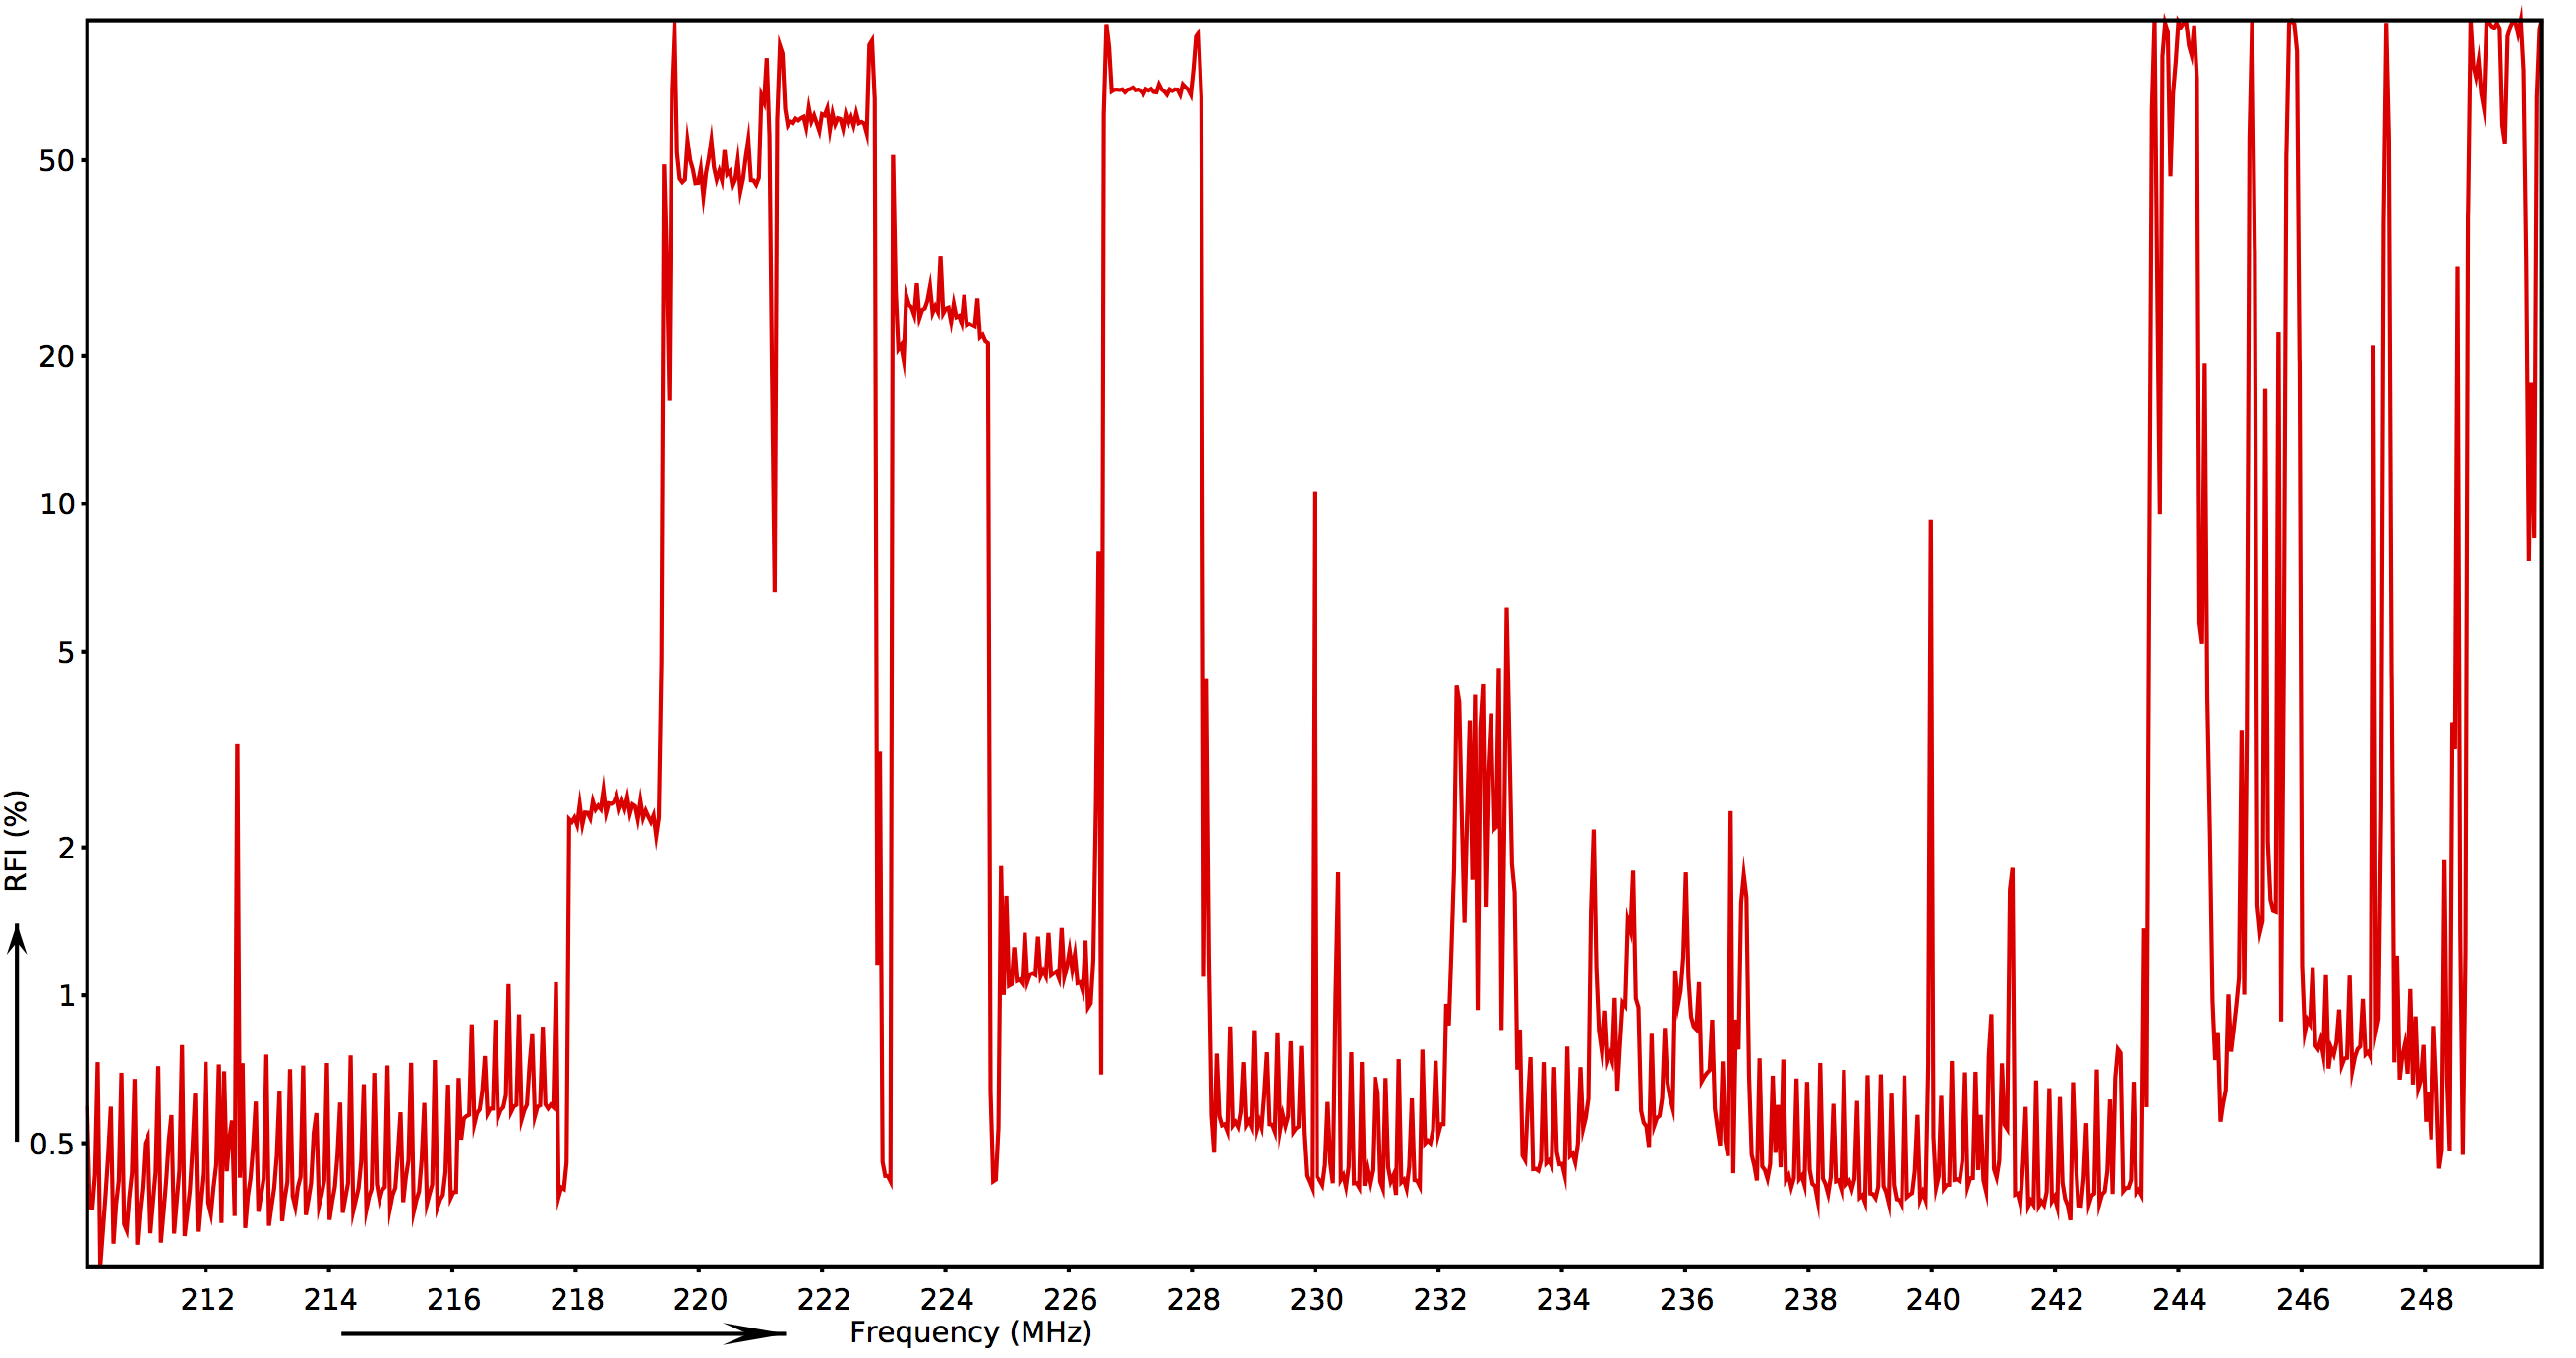
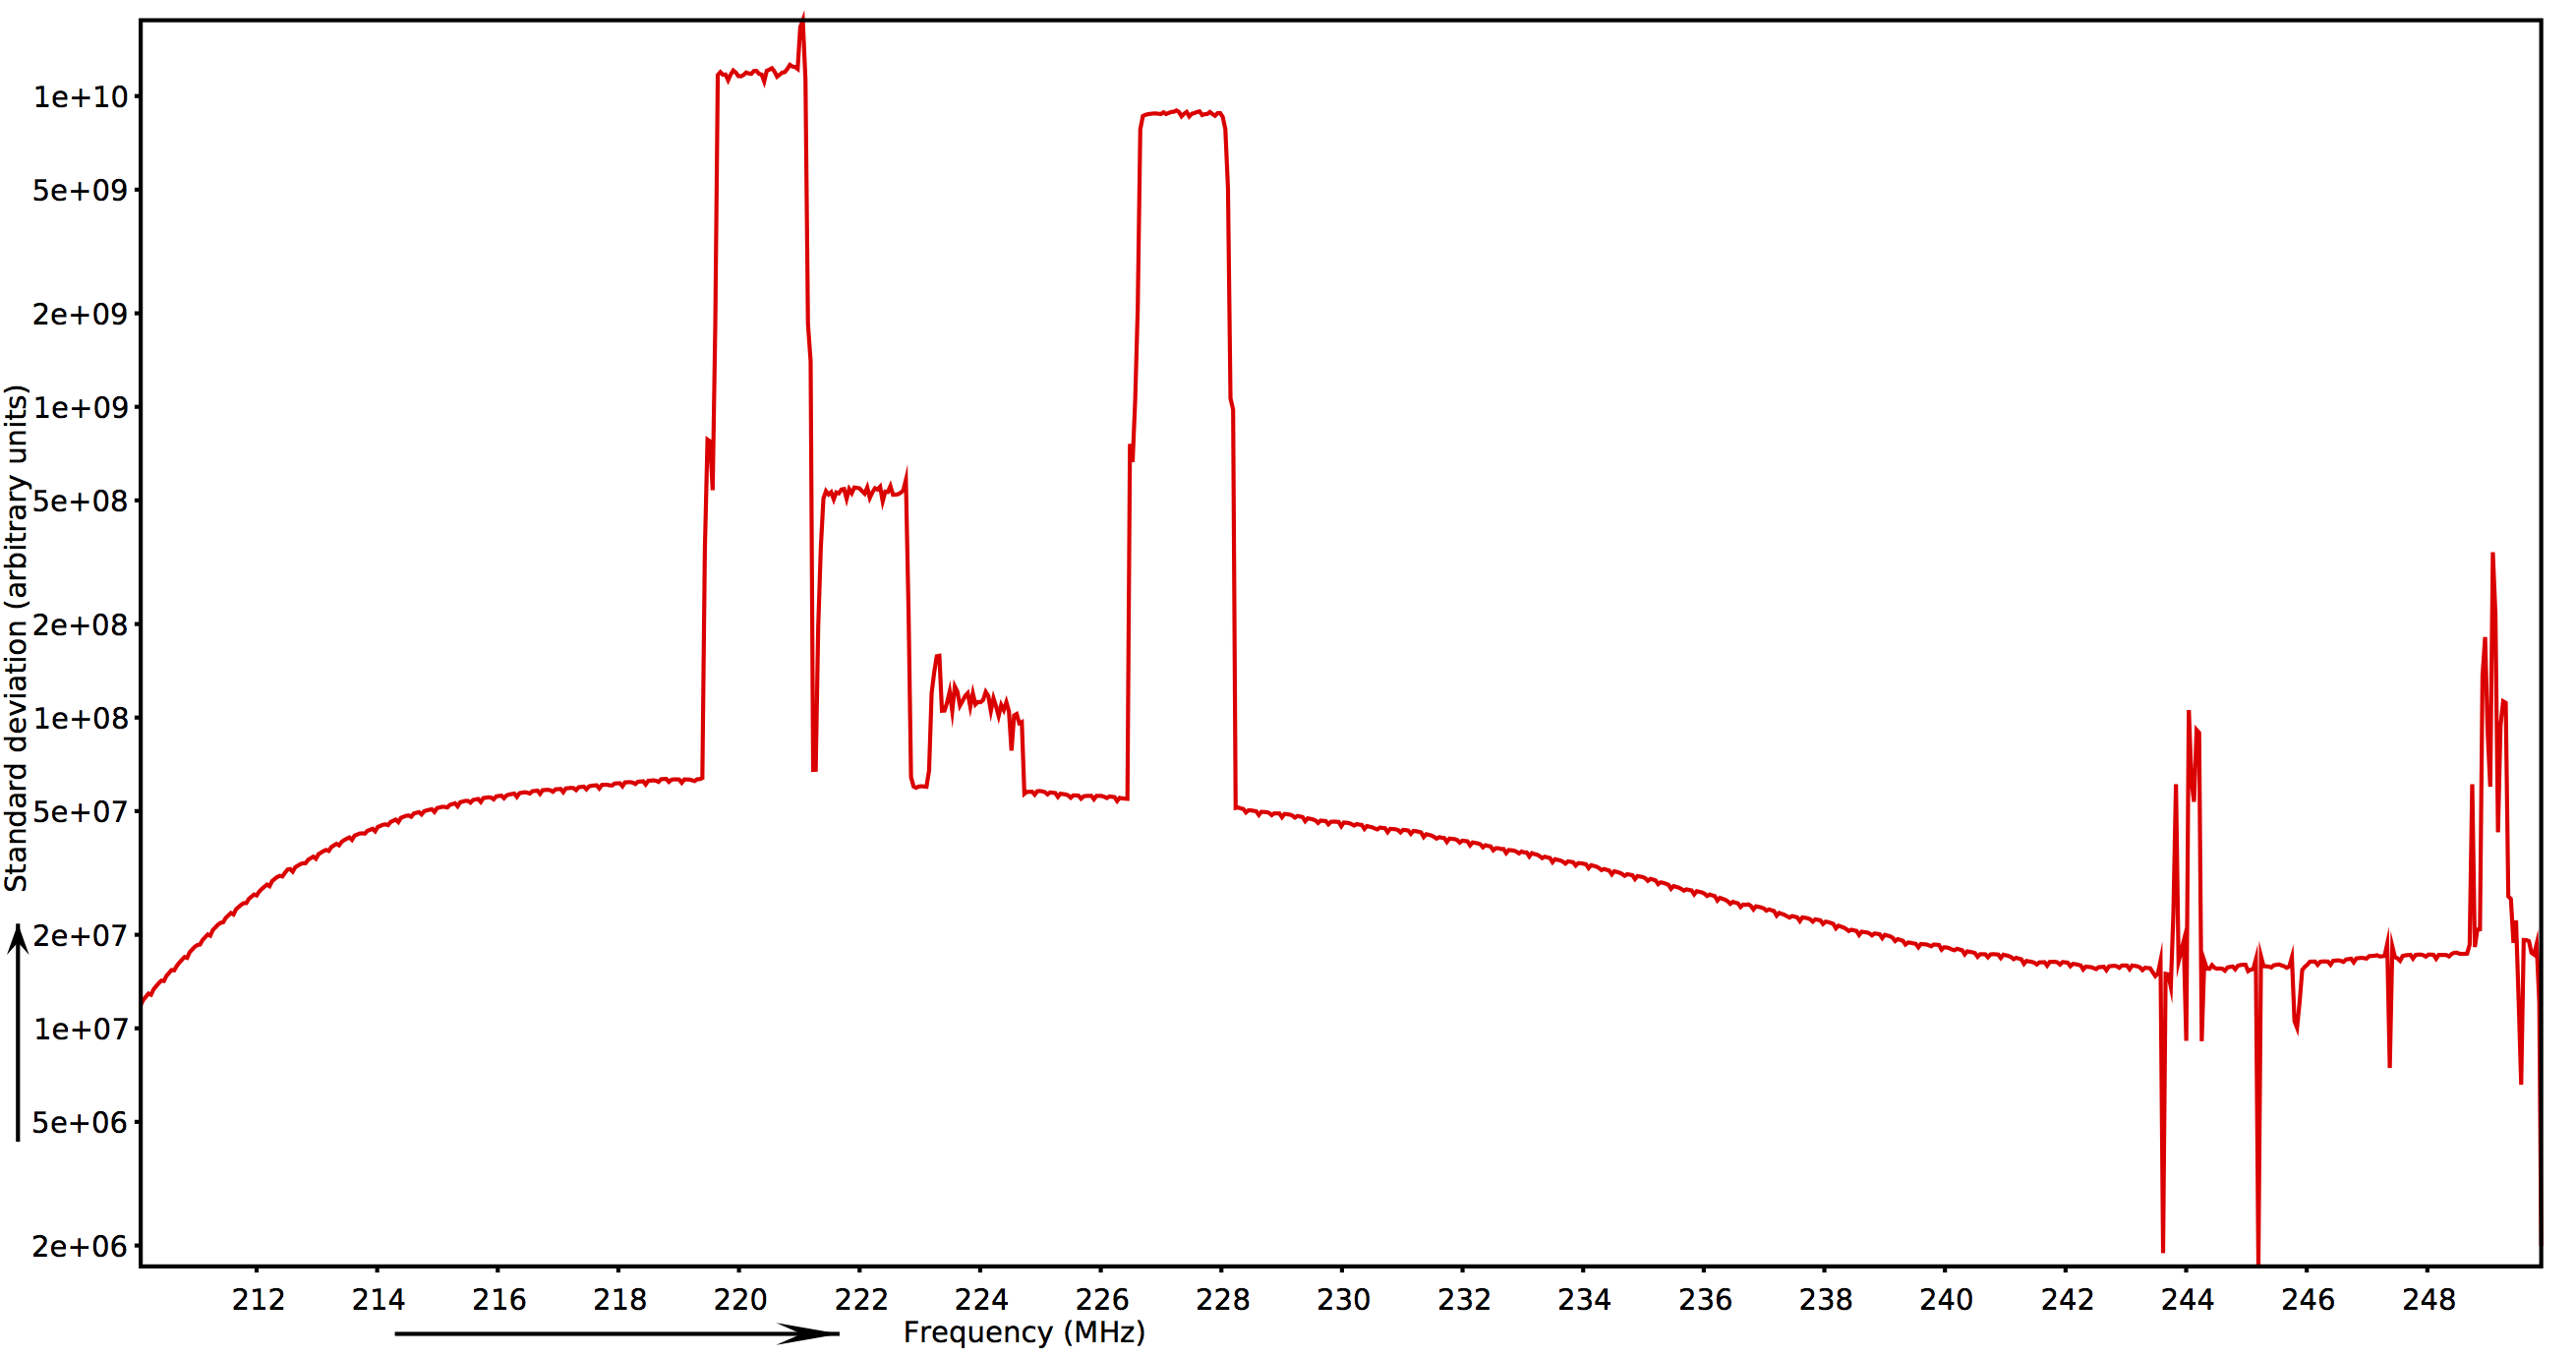
HBA high (clock 200MHz): RFI % and Standard deviation spectrum
Station Clock
The second clock system consists of a rubidium maser controlled by a GPS clock. Each station has its own independent GPS-controlled rubidium clock. In that sense, LOFAR operates by default in "VLBI mode", even on short baselines.
Since May 2010, the stations of the "superterp" (CS002, CS003, CS004, CS005, CS006 and CS007) have shared a common clock. Since September 2012, the single clock has been extended to all Core stations. Such array is suitable for tied-array observations, because no clock corrections are needed at the correlator.
Combining other stations into a tied-array will lead to decorrelation of the signal because the tied-array software currently does not correct for clock offsets and the offsets are comparable to the wavelength in the high band.
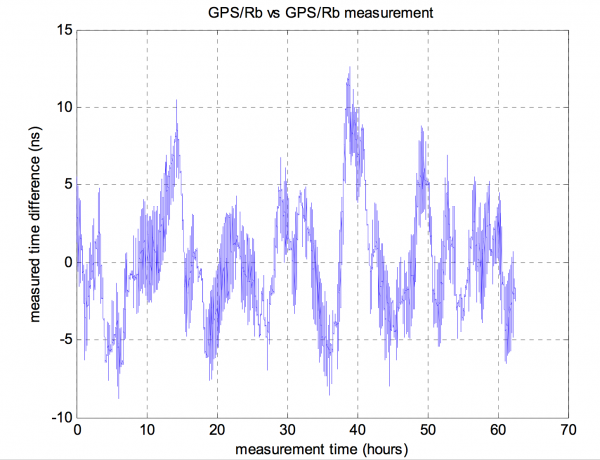
During a 2.5 day long test run, the time offsets between two stations using two GPS-stabilized rubidium masers had an RMS variation of 3.5 ns with peaks of the order of 10 ns. These time differences correspond to path length differences of 1 to 3 m, respectively.
More information on the clock system can be found in LOFAR Report 057 (pdf) by Andre van Houwelingen and Gijs Schoonderbeek.