Project and data workflow administration

Project and data workflow administration

    General User Administration


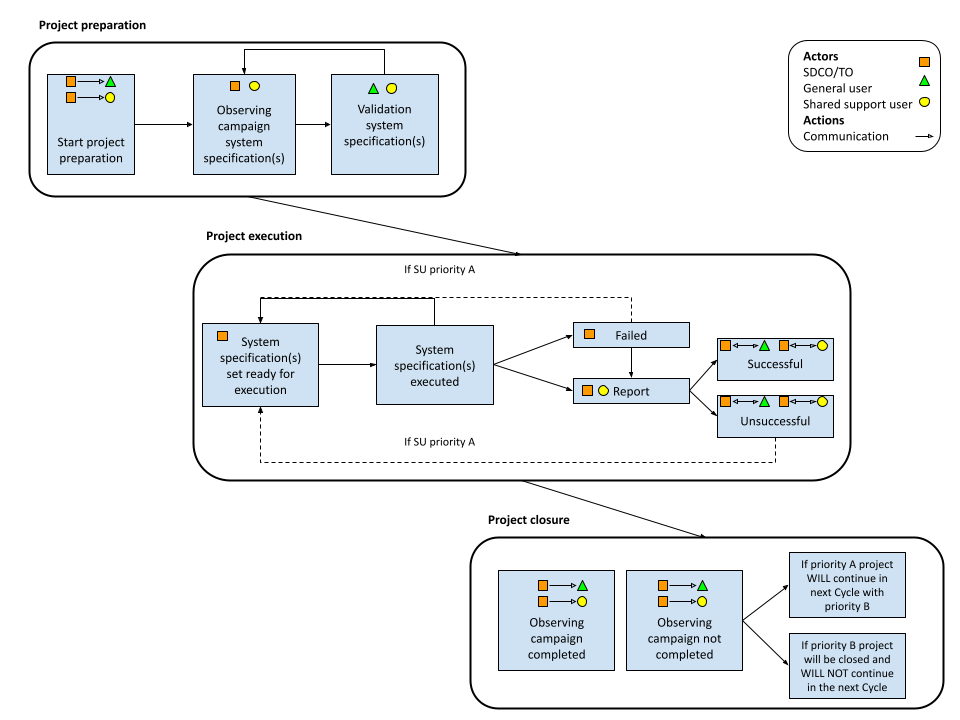
    Figure 1: Diagram shows the three phases of the science project administration workflow (project preparation, project execution and project closure) along with the main steps. Actors and their responsibilities are indicated with the symbols. See table below for details.

    Acronyms: SDCO - Science Data Center and Operations; TO - Telescope Operators; PC - Program Committee; SU - Scheduling Units; QA - Quality Assurance; TMSS - Telescope Manager System Specification; MoM - Management of Measurements

    Table 1: Project workflow
    Process steps SDCO General user User shared support mode
    Contact author is notified via Jira about the project preparation SDCO will open a ticket in Jira to be used as the communication channel for the science project between the contact author and SDCO The science project contact author will be responsible for providing any additional / missing info requested for the preparation of the observing campaign as well as for the acceptance of the delivered data. See here for instructions on how to use Jira.
    User specification (via the proposal in NorthStar) is converted / imported into TMSS SDCO will rely on the info gathered from the proposal as well as from the feedback given by the PC and technical teams The expert user(s) will rely on the info gathered from the proposal as well as from the feedback given by the PC and technical teams
    Check if any changes are needed to the proposed scheduling set; when ready the project status in TMSS is set to active SDCO collect info for later reporting.

    SDCO applies changes when needed if matching the allocated resources.

    SDCO/TO Change the status in TMSS

    The contact author will validate the specification in TMSS (follow the instructions in the section below) of the observing campaign and contact SDCO via the Jira ticket. The expert user(s) will validate the specification in TMSS for the observing campaign and contact SDCO via the Jira ticket

    SDCO/TO Change the status in TMSS

    The set of SU is approved for (dynamic) scheduling. TO/SDCO Change of status in TMSS TO/User Change the status in TMSS
    SU performed successfully & User accept data
    1. Report about QA of SU (SDCO/TO)
    2. SDCO unpin data
    Contact author receives notification (email / Jira) and as soon as possible provide feedback (please find here some instructions on how to assess the data quality)
    1. Report about QA of SU (TO/User)
    2. User unpin data
    SU successful & User does not accept data
    1. Report about QA of SU (SDCO/TO)
    2. SDCO unpin data
    3. SDCO removes data from LTA
    Contact author receives notification (email / Jira) and as soon as possible provides feedback. Note that rejection of data must happen within 4 weeks from the data delivery in the Long Term Archive (LTA) in order to apply for a repetition.
    1. Report about QA of SU (TO/User)
    2. User unpin data
    3. SDCO removes data from LTA
    SU failed
    1. TO/SDCO troubleshoot
    2. Failure report in Jira
    3. Repetition to be scheduled if applicable
    Contact author receives notification (email / Jira). Note that in some cases the science team may find the data acceptable and in such cases should contact ASAP via Jira SDCO.
    1. User/TO/SDCO troubleshoot
    2. Failure report in Jira
    3.  Repetition to be scheduled if applicable
    Closure of the project: prio A all SU performed & successful SDCO closes the Jira ticket and the changes the status in TMSS into finished and report
    Closure of the project: prio A part of SU performed successful SDCO closes the Jira ticket and the changes the status in TMSS into suspended and report.
    Closure of the project: prio B part of SU leftover. SDCO closes the Jira ticket and the changes the status in TMSS into finished and report.


    Quick guide on how to validate the specification of a scheduling set in TMSS:

    How to login

    Users can access TMSS by using credentials of NorthStar (and MoM) accounts:

    • If you forgot your password, please request a new password via the SDC helpdesk instead of making a new account.
    • If you don't have a NorthStar/MoM account, you can create a new account here.

    Once user credentials are available the user can access the login page here. Users must use the button Login with Keycloack to access the system. The user is next asked to provide the credentials in Keycloack.

    Users experiencing issues with the above procedure should send a request to the SDC Helpdesk. Note that currently TMSS only supports Firefox and Chrome browsers.

    How to access a science project and its scheduling units

    Once logged in TMSS the user will land on the Week view (Figure 2), which hosts a sidebar with menus, a search bar as well as help and logout buttons. An overview as function of time (per week) of planned SUs (and reservations) is offered for the user. Note that the view is filtered, i.e. is only exposed the SUs relevant for the user science projects. By this way it enables a quick access to the SUs content. The menu on the left allows users to navigate the different main pages.

    Figure 2: Weekly view with sidebar in TMSS

    To access the science project and its content click on Project. This provides an overview of the science projects, a collection of scheduling sets belonging to a scientific, commissioning proposal or to system tests. This is a filtered view based on the user permissions. Once on the Project page click on the eye icon of the project for which the specification needs to be validated.

    The user will land on the page of the project (Figure 3), where the top shows the properties of the project, including the allocated resources and the status of the projects (see Table 2).

    Table 2: Possible status of a project
    Status Meaning
    Opened Project has been created. Project properties may still be updated
    Active Project is active, observations can occur.
    Finished Project is finished. All observations have been taken, or the cycle (and next cycle) have passed and observations cannot be performed anymore.
    Cancelled The project is cancelled. No observation has been taken.
    Suspended The project is suspended (temporarily) from scheduling.

    The bottom panel presents a table view of the scheduling units (scheduling unit (SU) is a collection of system tasks such as e.g. observations, pipelines and ingest). From this view, the pointing details can also be viewed.

    [Note] If the angle columns do not appear, click the [ | ] icon to change the columns. (There is an issue with the target name, this will be fixed to represent the pointing name from the proposal, rather than target1,2,3).

    Figure 3: Scheduling set view of the project.

    In order to access the content and details of the SU(s) of interest, the user should click on the eye icon.

    The top section consists on a descriptive view of the general properties of the SU. Here useful links to the Blueprint and the science project container are provided. Table 3 shows the list of the possible status that a scheduling unit can undergo depending on which step of the process is running.

    Table 3: Possible status of scheduling units
    Status Description
    Defined The scheduling unit exists
    Schedulable The scheduling unit is defined and ready to be scheduled by the scheduler
    Unschedulable The scheduling unit cannot be scheduled because:

    1) The scheduling constraints can never be met

    2) There is a scheduling unit blocking this unit from being scheduled

    3) There are too many stations out for this scheduling unit to be scheduled

    Scheduled The scheduling unit is scheduled at this specific time
    Observing One or more observations are running.
    Observed All observations are finished (or obsolete)
    Processing The pipelines are active / in the queue. There are no observations running.
    Processed All pipelines are finished (or obsolete)
    Ingesting The ingest task is running (and no processing is running)
    Cancelled One or more tasks are cancelled
    Error One or more tasks are in error
    Finished All processes are finished, including ingest.

    The next section hosts a table view with listed tasks. Properties and (eventual editing) of each task can be accessed by clicking on the eye icon. For validation purposes the user should check if the tasks list is complete to fulfill the needed observing strategy (e.g. the number of observing tasks for both target and calibrators, as well as the number of related pipelines). Note that the strategy used in the SU (including observing and processing set up) is selected by the Friend of the project based on the user specifications given in the proposal, the technical panel report and PC stipulations.

    Moreover, the user must check the scheduling constraints (see Table 4), the exposure length and the pointings details (e.g. RA, DEC, names of targets) by scrolling down the page. Any inconsistency should be reported to the Friend of the project via the Jira ticket for editing. The scheduling constraints are used for (dynamic) scheduling to evaluate when observations can be scheduled. To check the scheduling constraints and pointing details of many scheduling units, the user can use the scheduling set editor, where they are provided in a table view. Please select each scheduling set and for each scheduling set the strategies in bold to verify all units. (Loading the table currently may take several minutes if there are many SUs).

    Table 4: Scheduling constraints description
    Field name Content Examples
    Scheduler Type of scheduling to use. Default is to use the dynamic scheduler, so observations are picked up automatically, but it is possible to specify fixed time scheduling.

    The first month of Cycle 17 we will use fixed time scheduling. After that it is only reserved for projects that need to be fixed in time.

    Dynamic
    Manual Fixed time
    at Run observations at this specific time. Only use this if really required, e.g., the target is also observed with another telescope. Specifying this circumvents priority scheduling and should be used with care. When in doubt, consult MI, StV.
    after Minimum start time of this scheduling unit. Default: start of cycle 2021-06-01 00:00:00
    before Maximum end time of this scheduling unit. Default: end of cycle 2021-11-30 23:59:59
    between Only schedule within the time windows specified here. More time-windows can be specified by pressing the + button below. This can be used to distinguish observations that should run monthly be specifying a few days where these observations could run. From: 2021-07-08 00:00:00
    Until:
    2021-07-10 23:00:00
    not between Do not schedule within the time windows specified here. More time-windows can be specified by pressing the + button below. From: 2021-07-08 00:00:00
    Until:
    2021-07-10 23:00:00
    Daily require_day : Day time observations. Run when the sun is higher than 10 degrees above the horizon at the Superterp.

    require_night : Night time observations. Run when the sun is lower than 10 degrees above the horizon at the Superterp.

    avoid_twilight : Avoid sunrise and sunset. Run when the sun is higher than 10 degrees above the horizon at the Superterp, or lower than 10 degress below the horizon.

    min_target_elevation Minimum elevation for all SAPs in the target observations
    min_calibrator_elevation Minimum elevation for the SAP of all calibrator observations
    transit_offset Offset in (UTC) seconds from transit for the average Right Ascension of the target observations. This can be used when the observation is split into shorted chunks to be observed at different LST ranges. Please take into account a one minute gap between subsequent observations. from -7200 to 7200
    from -7200 to -3600
    from 3600 to 7200
    min_distance Minimum distance to the Sun, Moon and Jupiter (latter mostly relevant below 30 MHz) in degrees (backend uses radians).

    Current default 30, or 28.64 degrees

    Sun: 30
    Moon: 30
    Jupiter: 30 (< 40 MHz ) else 15

    For your orientation, a preliminary schedule can be found at the following web address:

    https://science.astron.nl/telescopes/lofar/observing-with-lofar/previous-allocations-observation-schedules/

    The overall schedule is subject to change, as LOFAR is being further developed and the telescope operators have to respond to triggered observations as well as operational issues and maintenance.

    In view of the overall telescope schedule, the detailed preparation of upcoming observations that require any input provided from you will be initiated (under normal circumstances) by ASTRON staff at the latest two weeks ahead of your observations. Fundamental changes in the setup of your observations should be reported at least 10 days ahead of your observations. We cannot guarantee any changes to be made at a later time.

    As soon as the ASTRON personnel finishes the preparation you will be notified by email. In case you see errors on the “Details” overviews of the observations, you will be able to respond with any changes that need to be made until the last working day of the week prior to the week preceding the scheduled time of observation.

    Reporting

    After the observations and subsequent processing, you will be notified via the Jira ticket associated to the project and the requested data products will be made available through the archive as soon as possible.

    The Radio Observatory will not have the opportunity to check all data manually before it is exported, although some automatic diagnostics are generated for system monitoring, and offline technical monitoring will be carried out regularly. You will receive a notification after each observation for your project with detailed information on where to find the relevant plots. Your project team is encouraged to analyze their data, at least preliminarily, soon after the observations, and to get in touch through the ASTRON sdchelpdesk about any possible problems. Observations that turn out to have a problem that makes them unusable may be considered for only one re-run, as soon as the schedule allows.

    For more information about the observing and processing policies adopted by ASTRON during the LOFAR Cycles, please consult the ASTRON web pages at
    https://science.astron.nl/telescopes/lofar/lofar-policies/observing-and-processing-policies/

    Shared-Support Workflow and Duties

    For the Shared-Support workflow as well as documentation for the day to day duties of the Shared-Support user, please see below.

    Work flow diagram

    Duties

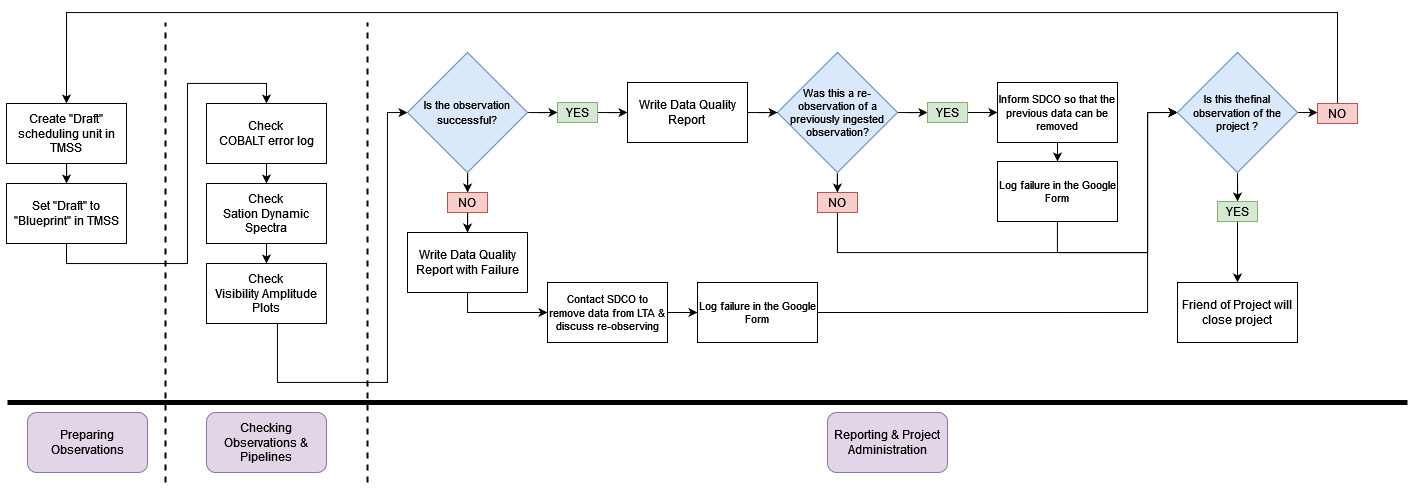
     1. Preparing Observations in TMSS

    In order to observe the proposed targets, the observing specifications & pipelines from the proposal need to be translated into system parameters that the telescope can understand. This is done via "scheduling units" in TMSS. For a detailed step by step guide please see the TMSS documentation here.
    1.1 Creating Draft scheduling unit

    You can add a scheduling unit from either the Scheduling Units tab or from a project page. Use the Celestin Herbe-George > Shared-Support guidelines > TMSS_icon_add.png button to add a scheduling unit.

    A scheduling unit is based on an observing strategy and part of a scheduling set. The observing strategy A scheduling set is a collection of scheduling units that can also be specified at the same time. The scheduling units can use one or more observing strategy. If no scheduling set exists, you can add one with the Celestin Herbe-George > Shared-Support guidelines > TMSS_icon_add.png button. You can specify all observations in the project into one scheduling set or use it to help you with the administration.

    For further instructions including specifying a scheduling set (which allows you to prepare many similar observations at once), please see the TMSS documentation here.

    Note: The ingest job is now included as part of the observing strategy so make sure this has been correctly specified.

     1.2. Scheduling the Draft

    In TMSS, the draft scheduling unit is scheduled by creating a blueprint. Once a blueprint is created, the observations can be scheduled immediately, so please first make sure all settings are correct.

    To create a blueprint press the Celestin Herbe-George > Shared-Support guidelines > TMSS_icon_blueprint.png button.

    • On the scheduling unit page
    • By first selecting scheduling units on the scheduling unit list page
    • By first selecting scheduling units from the list on the project page

    2. Checking Observations & Pipelines

    Data quality assessments for completed observations are performed to ensure the observations are acceptable within the LOFAR data policy. Before assessing the observations, ensure the observation cannot be considered failed (the criteria for a failed observation is outlined in the LOFAR data policy). If this is the case, the following assessment can be skipped and the procedure for failed observations described below should be followed. 

    The data quality assessment is done using a variety of tools that help assess the data at various stages along the data flow from the station. Most of the diagnostic tools are found on the inspection plot page of the observation here. To check the observations select the SAS ID of the observation for which you wish to inspect. A page will open, containing the following diagnostic information:

    • COBALT error log: reports any errors during the processing and recording in the correlator of the data stream.
    • Input loss report: reports the data loss from each station (if any).
    • Station dynamic spectra: shows the signal power at each station as a function of time and frequency. The core, remote and international station dynamic spectra are shown and can be used to check and report any unusual features in the station behaviour (such as RFI, presence of bright off-axis sources in the station beam and its sidelobes, oscillating tiles, etc.). For a detailed description of different features on individual inspection plots, see the What do I see here? page.
    • Visibility amplitudes plots: these are listed under the station dynamic spectra with format eg. SAP000 SB000. Each link shows the visibility amplitudes as a function of time for each individual subbands (frequency). From the displayed plots the behaviour as a function of frequency in the bandwidth of the observation can be checked. The different colour lines you see in the plots are relative to 4 signal combinations xx=dark blue, yy=red, xy=light blue, yx=pink. For an unpolarised source, xy and yx should be zero (within the noise), while xx and yy will contain the signals. Note that these plots are available for interferometric observations only. For a detailed description of the individual inspection plots, select the What do I see here? link.

    In case of a failed observation (the criteria for a failed observation is outlined in the LOFAR data policy), the expert-user must mark the failure on the google schedule, notify the SDCO team and report the failure:

    • Mark the observation as failed on the google schedule.
    • Since the data is automatically ingested by TMSS, notify the SDCO team through the project Jira ticket with the SASID so that they can remove it from the LTA.
    • Navigate to the LOFAR Observing Failures form and log the failure.

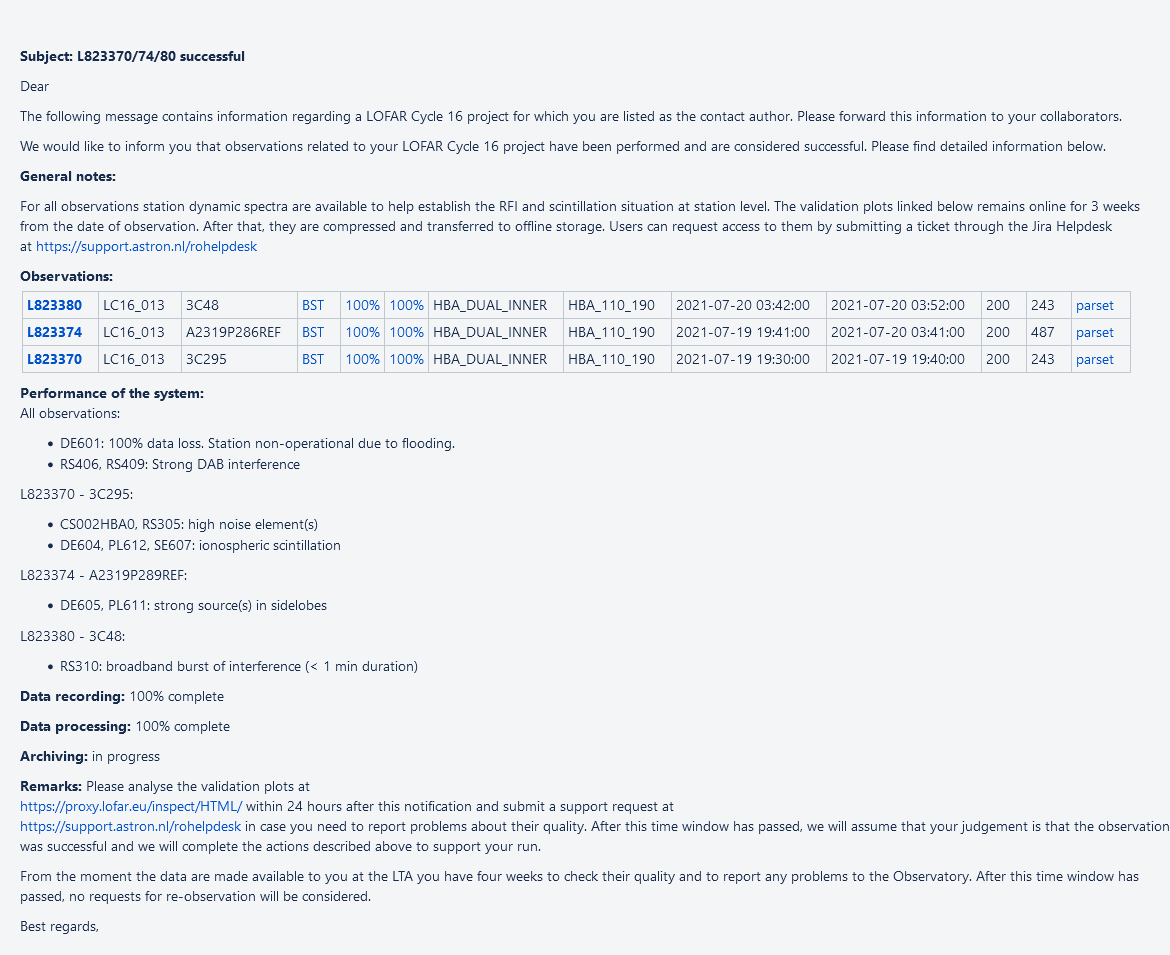
    3. Writing Data Quality Reports

    After checking the observations using the steps above, the Data Quality Report needs to be written.

    • Firstly, select the report template JIRA by selecting CANNED RESPONSES > BLANK OBS REPORT in the format bar of the text box. (If CANNED RESPONSES is not available see template at end of section)
    • State which observations are successful/failed. (The criteria for a failed observation is outlined in the LOFAR observing policy.)
    • Add the general notes i.e. comments that apply to all observations/stations.
    • Copy & paste the observation(s) row(s) from the inspection plots page to the Observations section.
    • Add the completeness of the data.
    • Add the performance of the system. For each observation, list the unusual features of the stations spotted when checking the observations.
    • Add the status of the data recording, data processing and archiving.
    • Finally, add remarks or specific actions required.
    Example Report:
    Blank Observation Report (Template):

    Dear Colleague,

    The following message contains information regarding a LOFAR Cycle 18 project for which you are listed as the contact author. Please forward this information to your collaborators.

    We would like to inform you that observations related to your LOFAR Cycle 18 project have been performed. Please find detailed information below.

    General notes:

    The validation plots linked below remains online for 3 weeks from the date of observation. After that, they are compressed and transferred to offline storage. Users can request access to them by submitting a ticket through the [Jira Helpdesk|https://support.astron.nl/sdchelpdesk|https://support.astron.nl/sdchelpdesk].

    Observations:

    SAS ID Campaign Target DynSpec Compl Compl* AntennaSet Band Start End Clock Subb Parset

    Performance of the system: Completeness of data recorded was %:

    Data recording:

    Data processing:

    Archiving:

    Remarks: Please analyse the validation plots at
    https://proxy.lofar.eu/inspect/HTML/ within 24 hours after this notification and submit a support request at
    https://support.astron.nl/rohelpdesk in case you need to report problems about their quality. After this time window has passed, we will assume that your judgement is that the observation was successful and we will complete the actions described above to support your run.

    From the moment the data are made available to you at the LTA you have four weeks to check their quality and to report any problems to the Observatory. After this time window has passed, no requests for re-observation will be considered.

    Actions:

    If you need any further clarification, please do not hesitate to contact us through the SDC helpdesk at https://support.astron.nl/sdchelpdesk , specifying your project code in the subject.

    Best regards,

    on behalf of Science Operations & Support

    SDC Helpdesk