The operating frequency range of LOFAR is 10 MHz to 240 MHz, while the antennas are optimized for the ranges of 30-80 MHz and 120-240 MHz. Because the optimized bandwidth of the operating frequency range spans 8 octaves, at least two types of antenna are necessary: the Low Band Antenna (LBA) and the High Band Antenna (HBA).
Low Band Antennas (LBA)
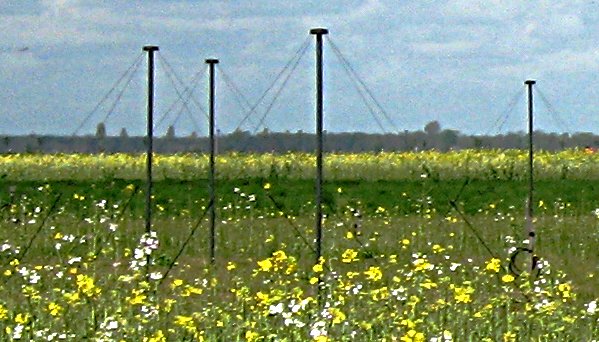
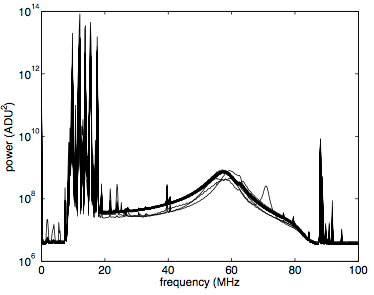
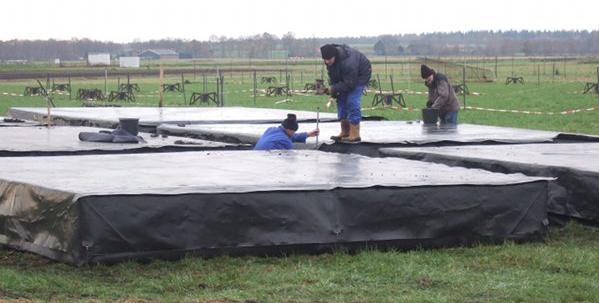
LBAs are designed to operate from the atmospheric spectral cutoff of the "radio window" at 10 MHz up to the onset of the commercial FM radio band at 90 MHz. A digital filter is employed to suppress the response outside of this band, with an optional filter to suppress the response below 30 MHz if desired. The LBAs consist of simple dual linear polarization (X and Y) droop dipoles above a conducting ground plane with the wires at an angle of 45 degrees with the ground.The dipole wires are connected to a molded head containing a low-noise amplifier (LNA). The molded head of the LBA rests on a vertical shaft of PVC pipe. The tension of the springs and the ground anchor hold the antenna upright and also minimize vibrations in the wires due to wind loading. The dipole itself rests on a ground plane consisting of a metal mesh constructed from steel concrete reinforcement rods. A foil sheet is used to minimize vegetation growth underneath the antenna. Each polarization has its own input and hence two coaxial cables per LBA element run through the vertical PVC pipe. Power is supplied to the LNA over these same coaxial cables. Examples of the LBA response curve are shown in the following figure:
Using digital beam-forming techniques, the omnidirectional response of the LBA antennae allows for the simultaneous monitoring of the entire visible sky.
High Band Antennas (HBA)
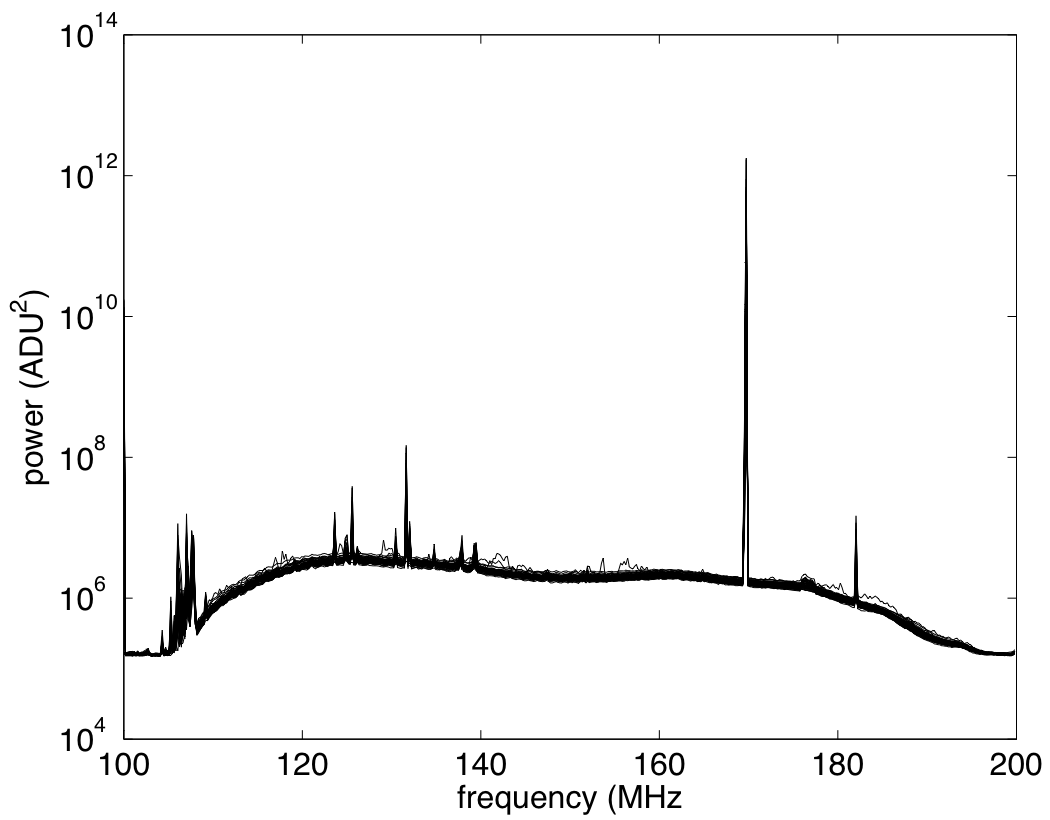
HBAs have been designed to operate in the frequency range between 120 and 240 MHz.
At these frequencies, sky noise no longer dominates the total system noise as is the case for the LBAs. Consequently, a different design was required to minimize contributions to the system noise due to the electronics.
Each HBA "tile" is an assembly of 16 bow tie shaped dual dipole antennas arranged in a 4x4 grid with a spacing of 1.25 m between the dipoles (measuring 5x5 m). Each HBA tile is equipped with an analogue radio frequency (RF) beamformer, which forms a single "tile beam" by combining the signal from these 16 antenna elements in phase for a given direction in the sky. This in turn limits the field of view of an individual tile to approximately 30 degrees at full-width half-maximum (FWHM) at a frequency of 150 MHz.
Tiles are then arranged in fields with three different layouts (see "Station Description and Configuration").
Note that the regular spacing of the HBA dipoles gives rise to grating lobes, with a strength comparable to or larger than the main beam.
The Bandpass
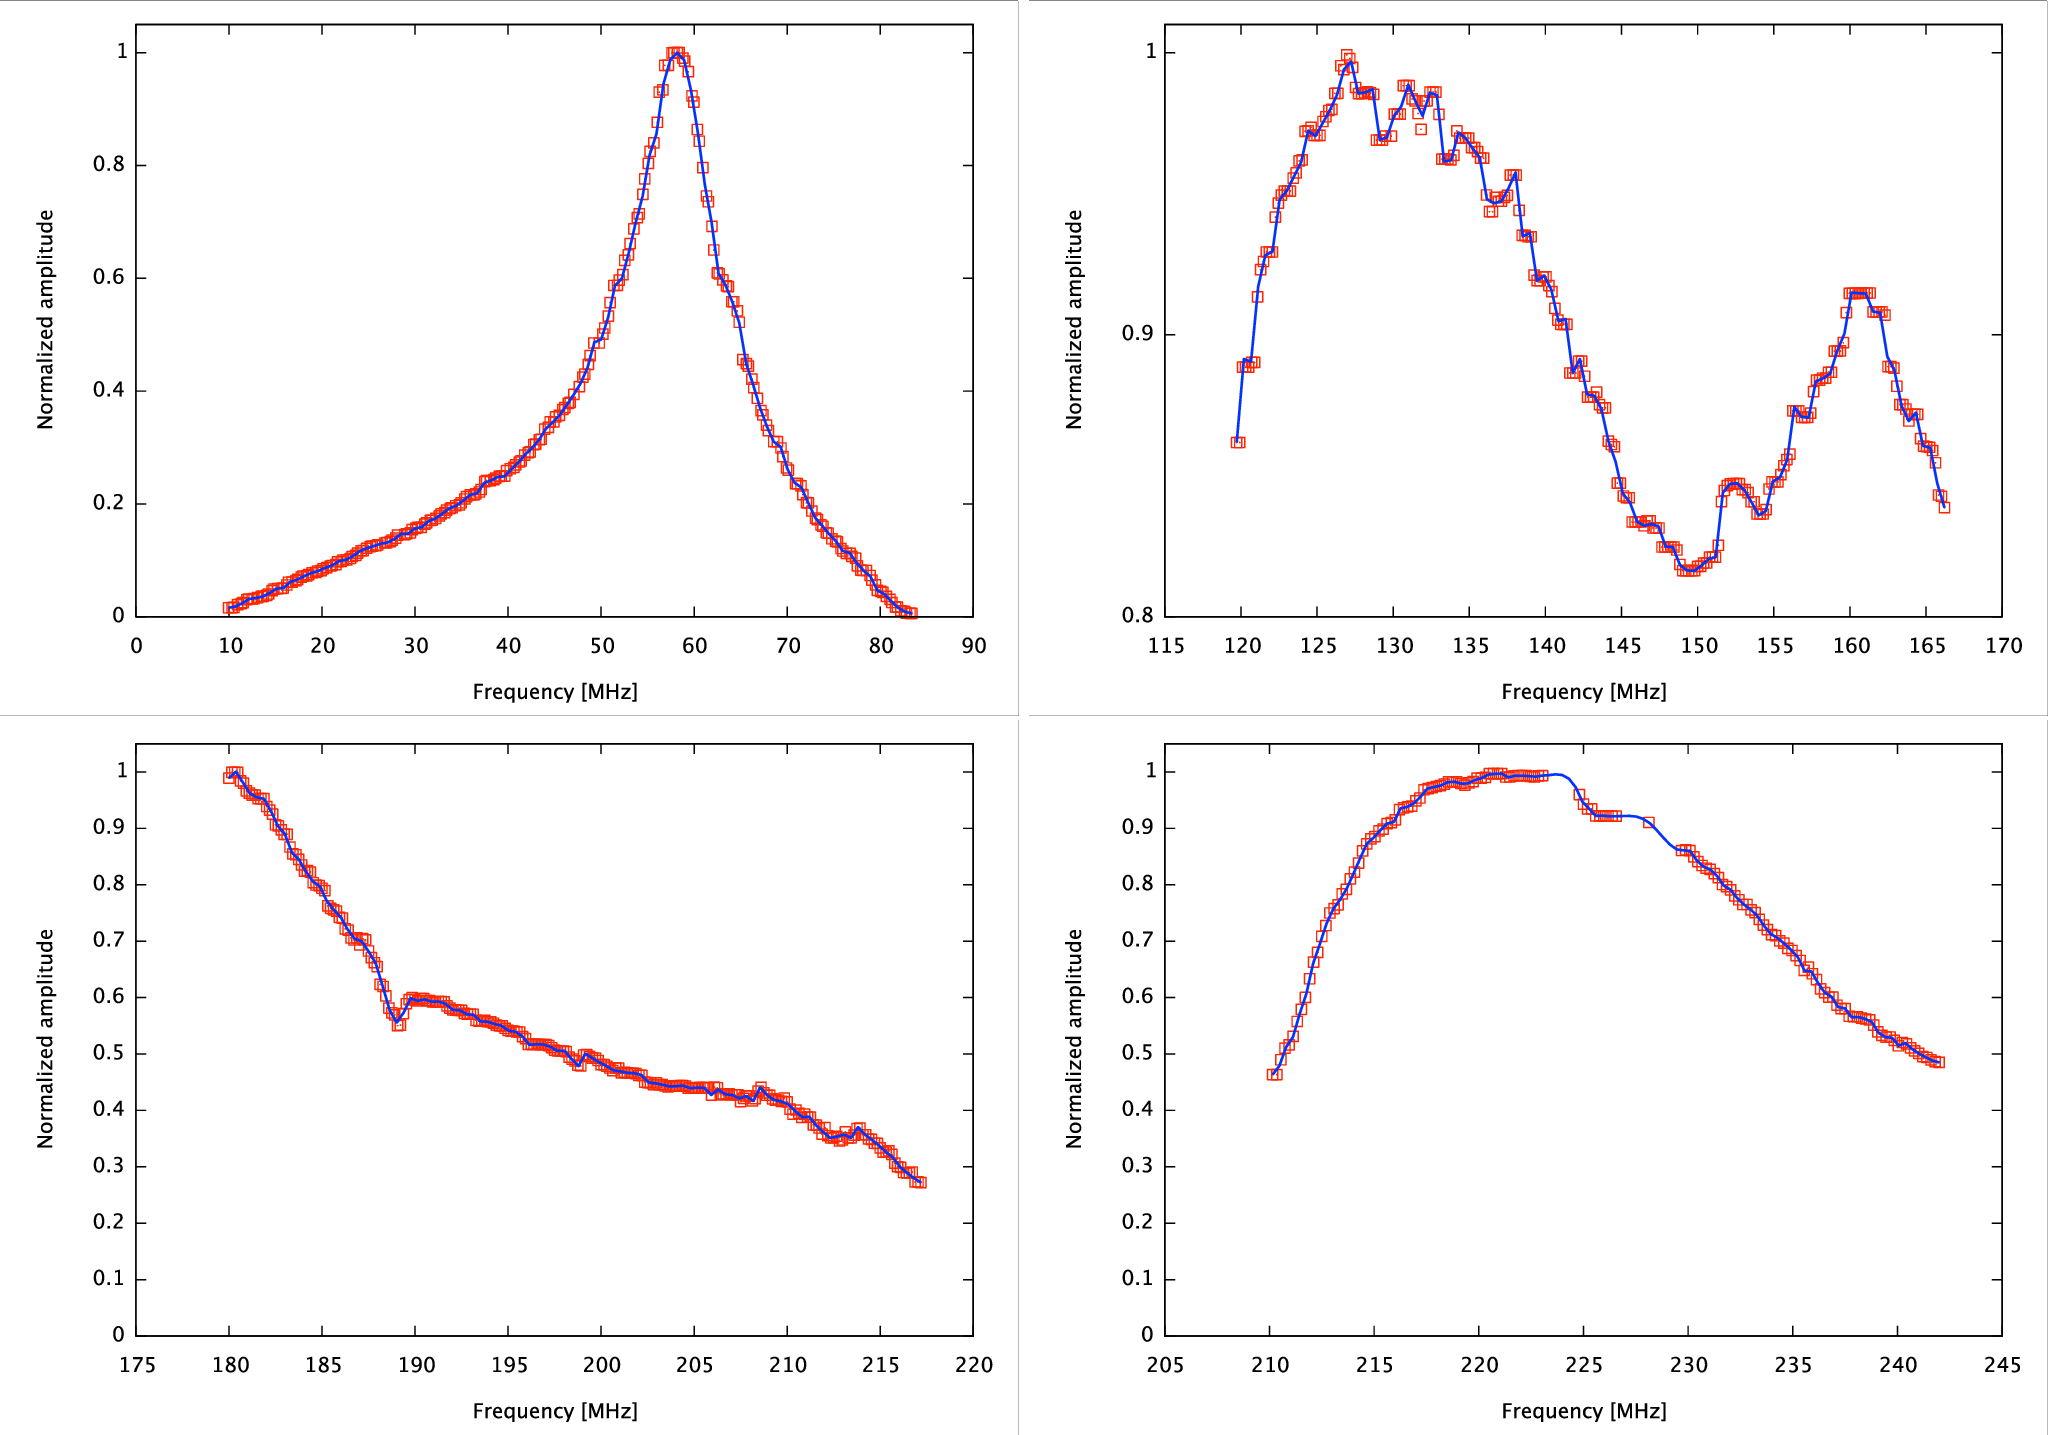
There are several contributions to the frequency-dependent sensitivity of LOFAR to incoming radiation (the bandpass). The physical structure of the individual receiving elements causes a strongly peaked contribution to the bandpass near the resonance frequency of the dipole. In the case of the LBA dipoles, the nominal resonance frequency is at 52 MHz. However, the actual peak of the dipole response is closer to 58 MHz in dry conditions. The LBA bandpass also displays a secondary bump around 62 MHz. This has been found to be due to some connections in the cables of the antenna elements. In particular, the intensity of this peak depends on the level of humidity accumulated inside the connections. Therefore, the intensity of this secondary peak varies for each station with time, depending on the local climatic conditions and on the specifics of each connection.
Determining the combined or “global” bandpass can be achieved during a calibration step after correlation. This global bandpass combines all those frequency-dependent effects in the system that have not already been corrected following correlation. To illustrate this point, the bright quasar 3C196 has been observed using the core and remote stations in the LBA and all three HBA bands. 3C196 is unresolved on the angular scales sampled by those baselines at LBA frequencies and has a known spectral energy distribution (Scaife & Heald 2012).
For each subband, a system gain was determined, and the gain amplitude was taken as the value of the global bandpass at the frequency of the particular subband. The median of all stations is shown in the figure below for a typical 10 min of data. Curves are shown for all four LOFAR observing bands.