The full inspection of processed LOFAR imaging data is currently not performed by the ASTRON. The user should retrieve the data from the archive and inspect them using the tools described in the LOFAR Imaging Cookbook.
Inspection Plots
After a LOFAR observation finishes, inspection plots are created automatically for the raw data. These plots are the only raw data inspection available to users before any data reduction. ASTRON inspects these plots after each observation and reports to the users all the macroscopic features present in the data. ASTRON relies on the users to thoroughly inspect the data quality after retrieval of the data from the LTA and report back any issue that might prevent them from achieving their scientific results.
Note: the current validation plots do remain available for 3 weeks (not 1 week) on a public web page. After that, they are compressed and PI’s and collaborators can request access to them through SDC Operations by submitting a JIRA ticket at the SDCO helpdesk.
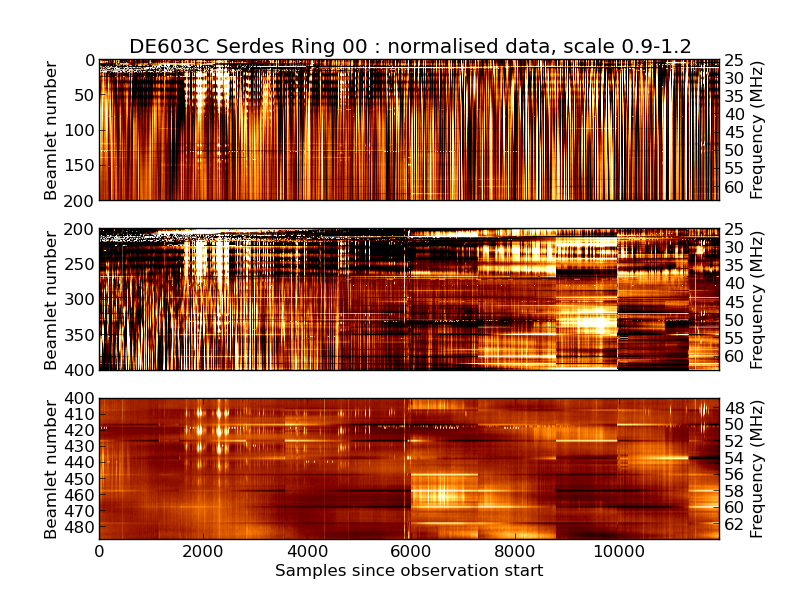
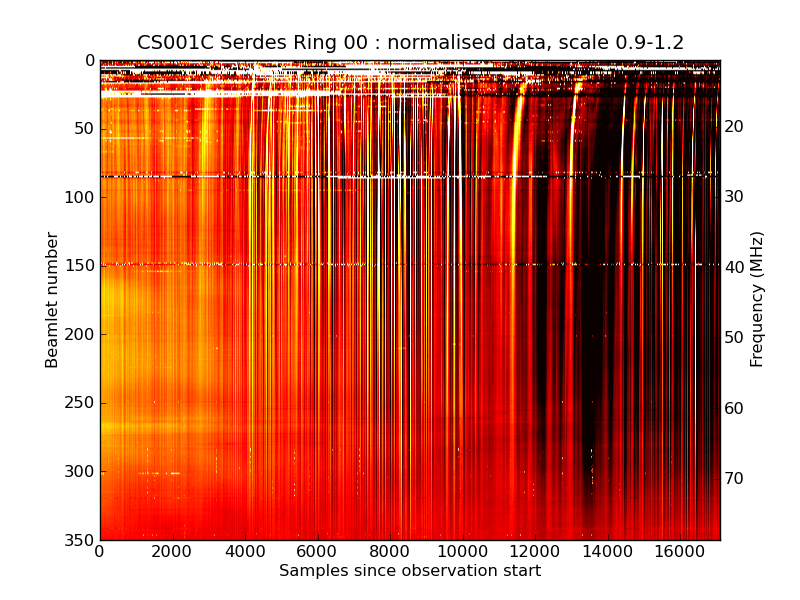
The inspection plots are available for both imaging observations and beam formed data and they consist of dynamic spectra produced using the LOFAR beamlet statistic. An example inspection plot is shown below.
A beamlet is a single station beam for a single subband and represents the way in which station beams (sub-array pointings) are specified at station level. A station beam as specified by the user will usually request a range of subbands, each of which will be represented by a beamlet at the station. Multiple station beams will correspond to successive blocks of beamlets. For example, if an observation contains two station beams each using 244 subbands the first beam will correspond to beamlet numbers 0-243 and the second to beamlet numbers 244-487.
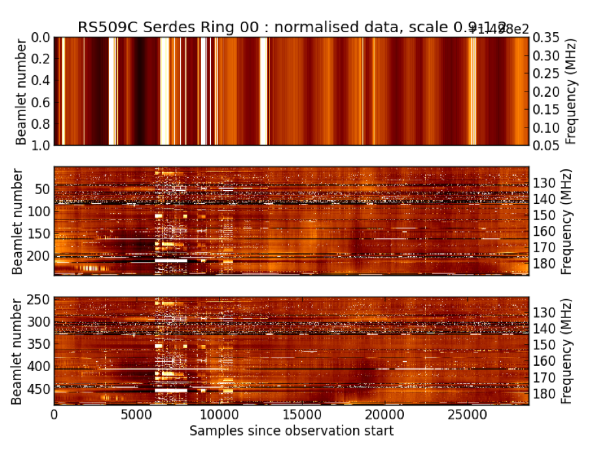
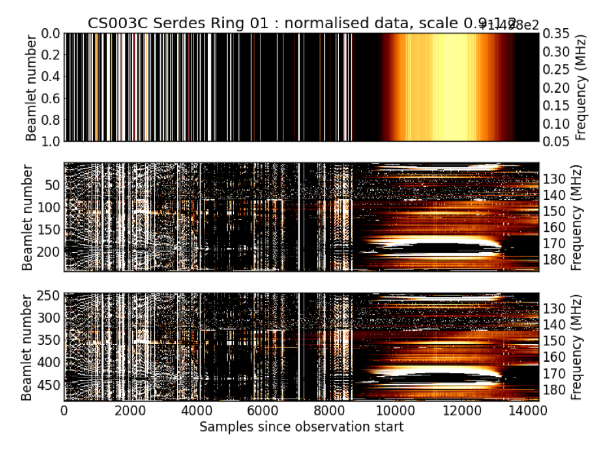
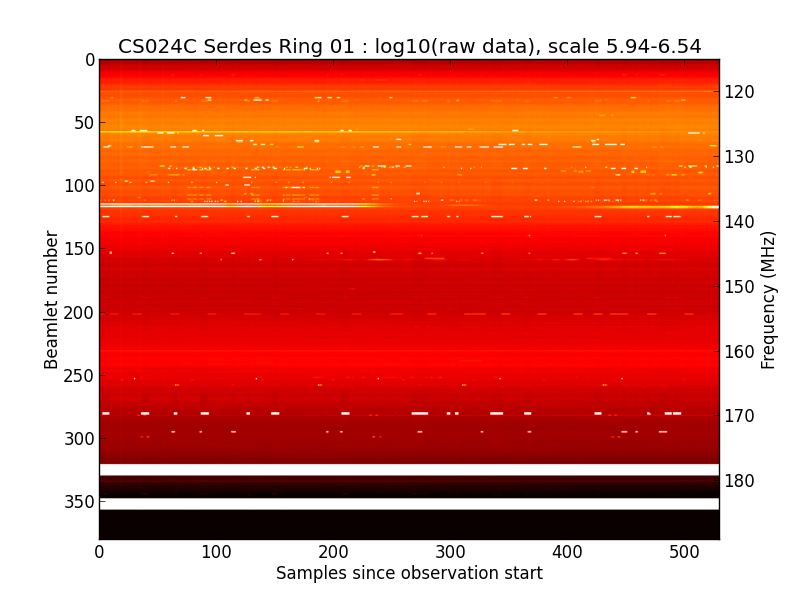
Beamlet statistics are recorded locally at each station and represent raw power values for X- and Y- polarisations for each beamlet, averaged to one second time resolution. The plots on the "BST" pages are simple dynamic spectra of these beamlet statistics: two pairs of plots are shown side-by-side, the left-hand pair are the raw data plotted using a log scale, and the right-hand pair are the raw data plotted with each beamlet divided by a fitted 3rd-order polynomial to flatten both the bandpass response and long time variations due to, for example, source elevation. Each pair is a plot of data from each serdes ring at a single station, with the '00' ring corresponding to the HBA0 field and the '01' ring corresponding to the HBA1 field. In the case of the remote and international stations, and non-HBA_DUAL/HBA1 observations, only the plots of the '00' ring display real data and those of the '01' ring can be ignored.
Numbers on the left-hand y-axis are beamlet numbers and do not correspond to subband numbers. An approximate frequency scale is given on the right-hand y-axis; please be aware that this takes only the minimum and maximum frequencies of each station beam and assumes that the subbands are spread evenly in between.
These plots can be used to establish the RFI and scintillation situation at each station and identify any obvious issues at station level.
Here you can find some examples to illustrate the features which may be seen and that can help users to identify problems in their data:
1) Ionospheric Scintillation - Scintillation of radio waves impacts the power and phase of the radio signal. Scintillation is caused by small-scale (tens of meters to tens of km) structure in the ionospheric electron density along the signal path and is the result of interference of refracted and/or diffracted (scattered) waves. Scintillation is usually quantified by two indexes: S4 for amplitude scintillation and σφ (sigma-phi) for phase scintillation. The indexes reflect the variability of the signal over a period of time, usually one minute. Scintillation is more prevalent at low and high latitudes, but mid-latitudes experience scintillation much less frequently. Scintillation is a strong function of local time, season, geomagnetic activity, and solar cycle but it also influenced by waves propagating from the lower atmosphere.
An example of strong scintillation impacting LOFAR observations is shown below.
2) Lightning storms - The lightning-radio frequency range is very broad. A large antenna used in a location with little electromagnetic activity may detect lightning strikes as far as 3,000 kilometers. LOFAR is very efficient in detecting lighting storms, they appear in the dynamic spectrum as very narrow vertical lines covering the entire frequency spectrum and lasting only few ms.
A quasi-real-time lightning map over Europe is available here.
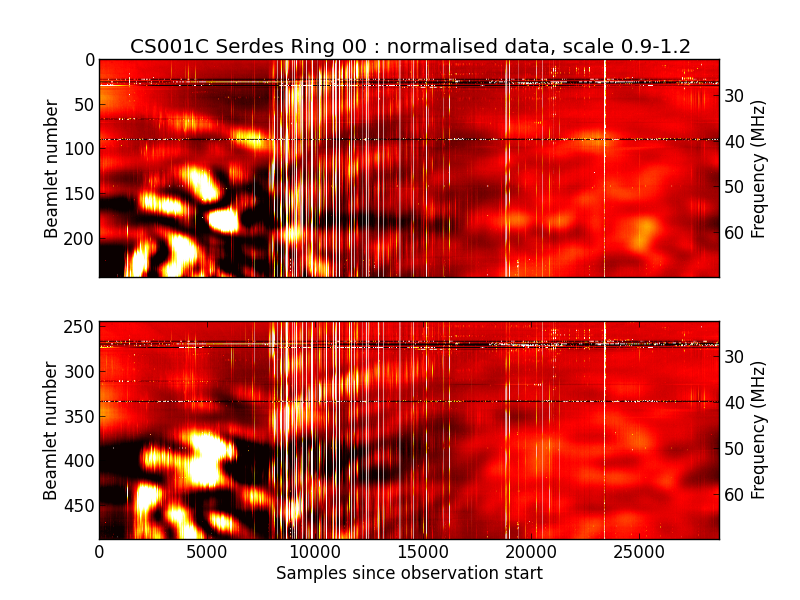
3) Solar Storms - Solar Activity can be a major source of interference for several astronomical radio observations. The emission at radio wavelenghts during a solar storm can be more than one order of magnitude brighter than the quiet Sun emission. Below you can find an example of a solar noise storm (type I storm) during an HBA LOFAR observation. Note that the telescope was observing a different region of the sky but the strong emission from the Sun was detected by the beam side-lobes.
A quasi-realtime spectrum of the Solar emission can be found here.
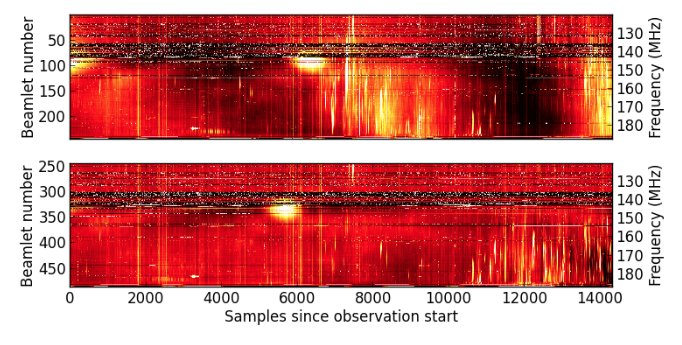
4) Other strong radio emitters (A-team) Interference - Strong source in the sidelobes of an observation may result in power features that can be seen in the lower left corners of each beam. An example of an HBA twin-beam observation with such interference in the sidelobes is shown below. These can also manifest as large-scale curving or looping structures in long observations.
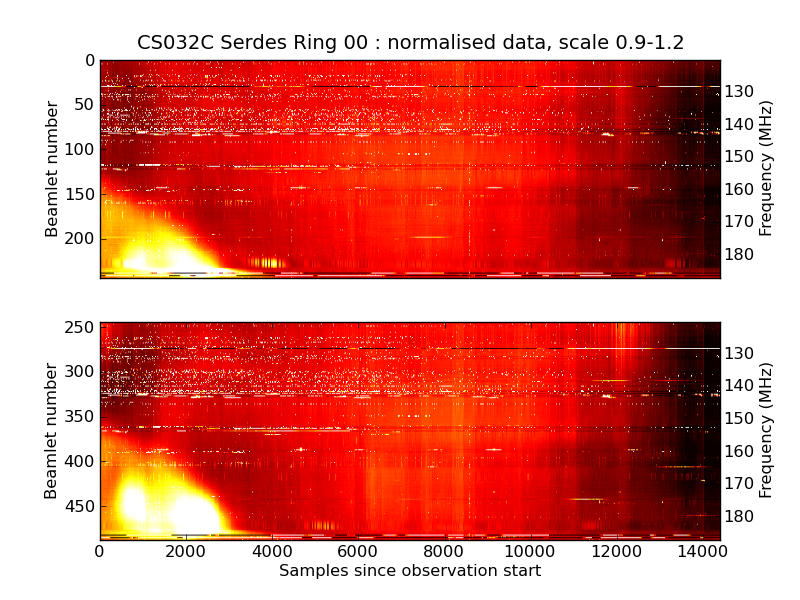
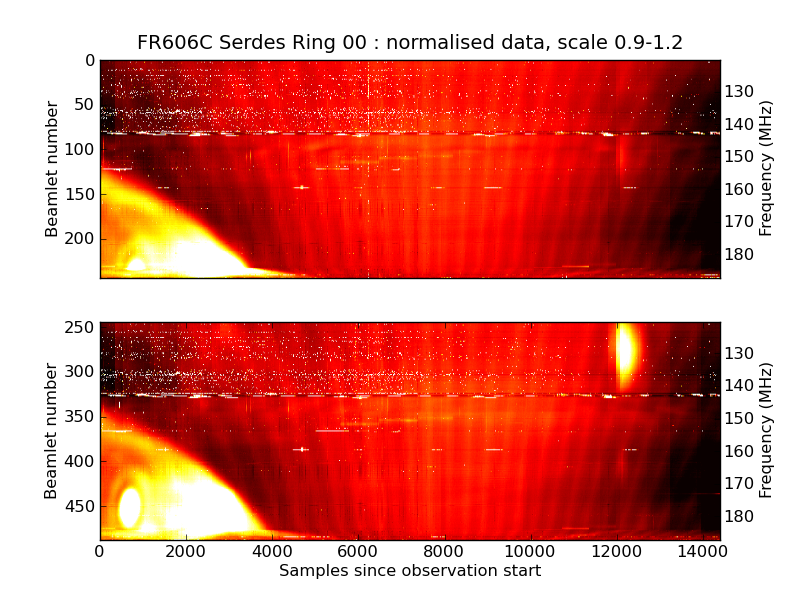
These A-team sources including the Sun may produce peculiar "fan" features in the dynamic spectrum. In the case of reflections from a large structure nearby this "fan" features may last for hours, See below an example from the station FR606 in HBA.
5) Terrestrial Interferences - Many terrestrial sources may affect the observations significantly. The sources may vary from the electronics and aircon units in the LOFAR field or they can be radio or TV transmitters nearby a LOFAR station.
TV Transmitter
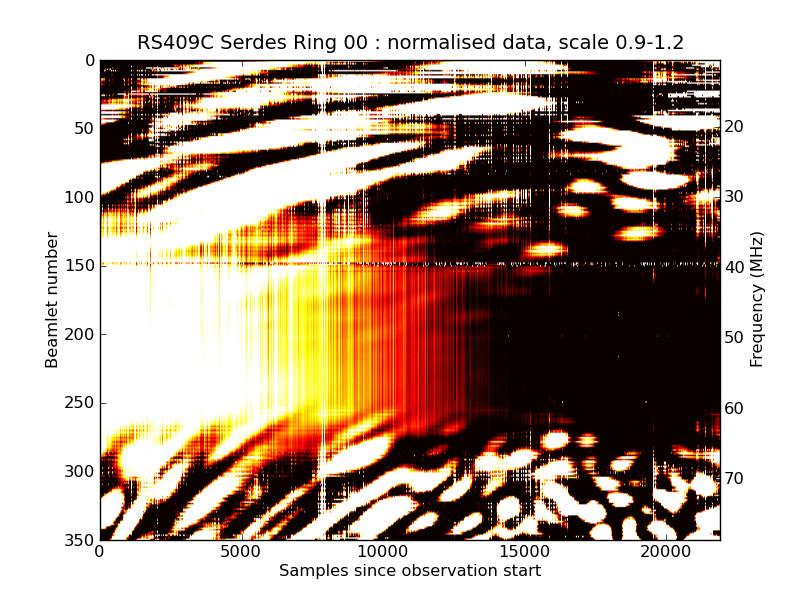
In this case the RFI is due to a strong out-of-band transmitter. The transmitter is the nearby Smilde tower producing leakage of FM radio band into the LBA observation.
Electric Fence
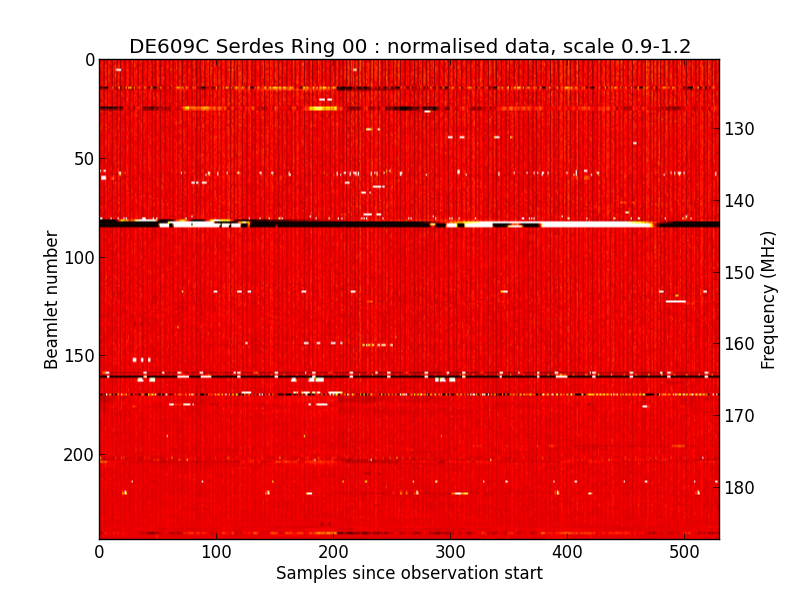
A common source of interference is created by electric fences in the areas around the telescope. Electric fences can generate radio noise. Essentially all radio interference originating from an electric fence is caused by a spark or arcing across some fence related hardware. Below you can find the result of these interferences in the LOFAR dynamic spectrum. Sharp, broadband interferences can be seen in the example spectra below.
Oscillating Tile
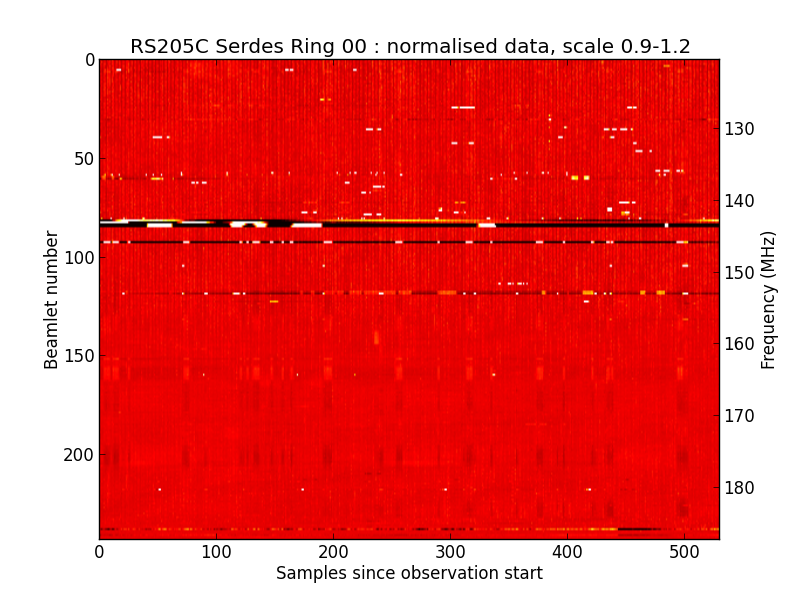
Another source of terrestrial interference can originate from the LOFAR station itself. If cables are not properly shielded the electromagnetic emission may leak from the system and be re-amplified, generating an "oscillating tile" feature in the spectrum. This feature may appear very different each time. Below you can find some examples.